Request Information
QUICK LINKS:
Overview Program competencies Program goals Curriculum Faculty & staff Tuition Admissions Careers & outcomes Student experience FAQs Accreditation Program guide University catalog NCCPA PANCE Program Exam Report Student attrition data Program policiesA purpose-driven PA education
The Central Coast Physician Assistant (CCPA) program at A.T. Still University’s College for Healthy Communities (ATSU-CHC) prepares students to become competent, community-oriented physician assistants dedicated to delivering whole person primary care. Designed for students pursuing entry-level PA education, the program emphasizes primary care practice, critical thinking, and service to medically underserved populations. Through a rigorous blend of classroom learning and hands-on clinical experiences, students develop the knowledge, skills, and professional attributes needed to provide compassionate, patient-centered care across diverse healthcare settings.
Program details
The Central Coast Physician Assistant (CCPA) program is a 24-month master’s curriculum comprising 110 credits of medical training. Upon successful completion, students are awarded a Master of Science in Physician Assistant Studies and gain eligibility for the national certification examination administered by the National Commission on Certification of Physician Assistants (NCCPA). Beyond academic excellence, the program is dedicated to cultivating primary care providers who possess a profound commitment to serving medically underserved communities and bridging gaps in healthcare equity. For more details about the program, view the School Performance Fact Sheet.
Mission
The Central Coast Physician Assistant program educates culturally competent Physician Assistants (PAs) from diverse backgrounds to serve the primary care needs of medically underserved communities.
Vision
The CCPA program will be recognized as the principal source of PAs providing high-quality, culturally-relevant care to medically underserved communities.
Values
- Professionalism and accountability: Demonstrates integrity, responsibility, and commitment to professional excellence, as well as respectful and ethical behavior.
- Lifelong learning: Demonstrates commitment to intentional, continuous learning and reflection to advance evidence-based medical knowledge and pursue personal growth.
- Humility and empathy: Demonstrates awareness of one’s personal and professional biases and attitudes while supporting diverse perspectives, inclusive environments, and compassion toward others.
Hometown Scholars
The Hometown Scholars program helps ATSU meet the needs of community health centers by identifying, attracting, and educating dedicated, motivated, and qualified community-minded healers. Being a Hometown Scholar is not required for admission to the Central Coast PA Program. However, applicants who meet all other program admission requirements and receive an official endorsement from their local community health center will be given points in the program’s holistic applicant review process. In addition, they will receive an automatic invitation to interview. The endorsement letter MUST be submitted with the secondary application. If the letter of endorsement is received at a later time, the applicant will NOT be eligible for Hometown Scholar for this application cycle. Please contact Ann Marie Rucker, University Partnerships Coordinator, by emailing annmarierucker@atsu.edu for more information.
Upcoming events
Join us to learn more about ATSU’s CCPA program. Our virtual information sessions focus on the curriculum, faculty, admissions, tuition, and more.
Flexible curriculum for aspiring leaders
The curriculum of the Central Coast Physician Assistant program equips students with the knowledge and skills necessary to advance their careers and positively impact health outcomes. For more details about the CCPA program and the University, check the University Catalog.
Curriculum overview:
Didactic year credits: 66
Clinical year credits: 44
Total credit hours: 110
VIEW PROGRAM FACT SHEETThe didactic phase of the program consists of a comprehensive 66-credit hour curriculum designed to transition students from foundational medical knowledge to clinical proficiency. This year is primarily centered at our San Luis Obispo campus, where over 90% of the instruction occurs in a high-energy, collaborative environment. To balance rigorous on-site training with modern flexibility, a small portion of the curriculum (less than 10%) is delivered through independent asynchronous work, allowing students to engage with core concepts at an individualized pace.
Instruction is delivered through a sophisticated blend of traditional lectures and modern Case-Based Learning (CBL). Students participate in classroom demonstrations, group discussions, and collaborative case studies that mirror the complexities of modern medicine. This approach ensures that students do not just memorize facts but actively develop the clinical reasoning skills necessary to diagnose and treat patients. Throughout the year, students move fluidly between large-group lectures and small-group sessions, fostering a tight-knit community of peer-to-peer learning.
A hallmark of the didactic year is the immediate application of theory through intensive, hands-on lab sessions. In these settings, students master clinical procedures, perfect the art of medical history taking, and develop precision in performing physical examinations. To ensure students are "rotation-ready," the program utilizes Simulated Patient Encounters. These simulations provide realistic, high-stakes scenarios in a controlled testing environment, bridging the gap between classroom learning and the real-world demands of clinical rotations.
The didactic year utilizes an innovative classroom instructional model that integrates remote expertise with a core in-person experience. By leveraging advanced audiovisual technology, including high-fidelity microphone systems and large-scale displays, experienced clinicians deliver specialized lectures to students gathered in a traditional classroom, ensuring real-time interaction and collaborative group work. To reinforce this approach with personalized mentorship, remote faculty visit the San Luis Obispo campus on a rotating basis, ensuring that the majority of weekly instruction is delivered face-to-face. Furthermore, every didactic faculty member spends at least one full week on campus per academic term, providing students with consistent access to professional role models and dedicated academic support.
| Term One- Didactic Year (15 Credit Hours) | |
| CCPA 5001 - Clinical Science I | 5 credit hours |
| CCPA 5002 - Clinical Medicine I | 4 credit hours |
| CCPA 5040 - Patient Assessment I | 4 credit hours |
| CCPA 5080 - PA Professional Practice I | 2 credit hours |
| Term Two- Didactic Year (16 Credit Hours) | |
| CCPA 5011 - Clinical Science II | 6 credit hours |
| CCPA 5012 - Clinical Medicine II | 6 credit hours |
| CCPA 5050 - Patient Assessment II | 2 credit hours |
| CCPA 5090 - PA Professional Practice II | 2 credit hours |
| Term Three- Didactic Year (18 Credit Hours) | |
| CCPA 5021 - Clinical Science III | 4 credit hours |
| CCPA 5022 - Clinical Medicine III | 6 credit hours |
| CCPA 5060 - Patient Assessment III | 3 credit hours |
| CCPA 5100 - PA Professional Practice III | 2 credit hours |
| CCPA 5025 - Technical Skills & Preparation for Clinical Practice I | 3 credit hours |
| Term Four- Didactic Year (17 Credit Hours) | |
| CCPA 5031 - Clinical Science IV | 4 credit hours |
| CCPA 5032 - Clinical Medicine IV | 4 credit hours |
| CCPA 5070 - Patient Assessment IV | 3 credit hours |
| CCPA 5110 - PA Professional Practice IV | 3 credit hours |
| CCPA 5035 - Technical Skills & Preparation for Clinical Practice II | 3 credit hours |
The clinical year of the Central Coast Physician Assistant (CCPA) program is a rigorous, 44-credit hour immersion designed to transform students from classroom learners into competent, practice-ready clinicians. Building upon the foundational sciences mastered during the didactic phase, this year is defined by Supervised Clinical Practice Experiences (SCPEs) that challenge students to apply their knowledge across a vast spectrum of medical disciplines and patient populations.
A defining and unique feature of the CCPA program is our commitment to health equity: 100% of our students complete SCPEs within medically underserved populations and/or community health centers. While many programs offer these settings as optional electives, we integrate them as a core requirement for every student. This immersion provides a distinct advantage, allowing students to develop a sophisticated level of cultural humility and resourcefulness that is rarely achieved in more traditional clinical tracks. By working on the front lines of community health, students learn to navigate complex social determinants of health, manage chronic conditions with limited resources, and advocate for patients who face significant barriers to care.
Throughout these rotations, students transition from observing care to actively managing it, refining core clinical competencies ranging from interpersonal mastery to advanced psychomotor skills, such as suturing and clinical procedures. Students are expected to demonstrate proficiency in performing exhaustive patient evaluations, evidence-based prescription writing, and the synthesis of comprehensive patient management plans. This focus on underserved care ensures that CCPA graduates emerge not only as skilled medical providers but as compassionate leaders uniquely prepared to meet the most pressing needs of the modern healthcare landscape.
| Clinical Year Courses Terms 5-8 (44 Credit Hours) | |
| CCPA 6201 - Community Medical Experience I | 5 credit hours |
| CCPA 6202 - Community Medical Experience II | 5 credit hours |
| CCPA 6203 - Community Medical Experience III | 5 credit hours |
| CCPA 6204 - Community Medical Experience IV | 5 credit hours |
| CCPA 6205 - Community Medical Experience V | 5 credit hours |
| CCPA 6206 - Community Medical Experience VI | 5 credit hours |
| CCPA 6207 - Community Medical Experience VII | 5 credit hours |
| New - Elective Clinical Rotation | 5 credit hours |
| Callback week One/Course Name TBD | 2 credit hours |
| Callback week Two/Course Name TBD | 2 credit hours |
| CCPA 6311 - Transition to Practice I | 2 credit hours |
| CCPA 6312 - Transition to Practice II | 4 credit hours |
| CCPA 6100 - Clinical Seminar I | 1 credit hour |
| CCPA 6110 - Clinical Seminar II | 1 credit hour |
| CCPA 6120 - Clinical Seminar III | 1 credit hour |
Central Coast Physician Assistant program courses
The Central Coast Physician Assistant program is a 24-month course of study consisting of 110 credit hours. The curriculum aims to develop and enhance professional skills and competencies needed to advance and address today’s challenges healthcare systems.
The course schedule for the didactic year (terms 1-4) consists of the following for a total of 61 credit hours.
Term one (15 credit hours)
5 Credits
Clinical Science I is the first course in a four-part series that comprehensively integrates foundational medical sciences with their application to clinical practice. The course introduces genetic and molecular mechanisms of health and disease; characteristics of microbial pathogens; and the anatomy, physiology, and pathophysiology of major organ systems. Students will develop the ability to relate physiological and pathophysiological processes to diagnostic studies. Foundational pharmacology and pharmacotherapeutic principles are introduced with a focus on the initiation and monitoring of pharmacologic management. Prerequisite(s): Admission to and matriculation in the CCPA program.
4 Credits
Clinical Medicine I is the first course in a four-part, system-based series designed to introduce and build core clinical reasoning skills. Students will learn a systematic approach to patient assessment by integrating medical history, physical exam findings, and diagnostic study results with foundational medical knowledge. Emphasis is placed on generating accurate differential diagnoses, formulating and implementing evidence-based treatment plans, including pharmacologic therapies, and providing appropriate patient education and referrals. The course covers epidemiology, etiology, pathophysiology, clinical presentation, diagnosis, evaluation, and management for a variety of common diseases and disorders across major body systems. Prerequisite(s): Admission to and matriculation in the CCPA program.
4 Credits
Patient Assessment I is the first course in a four-part series focused on developing foundational clinical skills. The course introduces students to medical history taking, physical examination techniques, and core clinical reasoning skills. Students learn to integrate history and examination findings to guide diagnostic decision-making, formulate differential diagnoses, and outline management plans. Instruction also emphasizes effective oral case presentation and accurate documentation of patient encounters. This course features hands-on teaching labs to ensure students master essential physical examination and diagnostic skills. Prerequisite(s): Admission to and matriculation in the CCPA program.
2 Credits
PA Professional Practice I is the introductory course in a four-part series designed to establish the professional and ethical foundations of the Physician Assistant profession by exploring the history and evolution of the PA profession, defining the roles and professional expectations of clinicians, and emphasizing the importance of personal well-being. This course provides an introduction to the broader healthcare context, covering healthcare policy, health law, the public health system, and preventive care guidelines, including USPSTF screening and CDC recommendations. Students will develop core professional skills essential for lifelong practice, including the ability to apply evidence-based medicine through the searching and critical interpretation of medical literature, and fostering a commitment to continuous self-assessment and performance improvement. Prerequisite(s): Admission to and matriculation in the CCPA program
Term two (16 credit hours)
6 Credits
Clinical Science II is the second course in a four-part series that comprehensively integrates foundational medical sciences with their application to clinical practice. Building upon Clinical Science I, the course deepens students’ understanding of genetics, microbiology, anatomy, physiology, and pathophysiology across major organ systems. Students will relate physiological and pathophysiological processes to patient history, physical exam findings, and diagnostic studies. Students advance their understanding of pharmacology and pharmacotherapeutics concepts, including drug-drug interactions, evidence-based regimens, and long-term monitoring. Prerequisite(s): Admission to and matriculation in the CCPA program.
6 Credits
Clinical Medicine II is the second course in a four-part system-based series designed to introduce and build core clinical reasoning skills. Building upon Clinical Medicine I, students refine their ability to integrate medical history, physical exam findings, and diagnostic study results with expanding medical knowledge. Emphasis is placed on generating accurate differential diagnoses, formulating and implementing evidence-based treatment plans, including pharmacologic therapies, and providing appropriate patient education and referrals. The course deepens students’ understanding of the epidemiology, etiology, pathophysiology, clinical presentation, diagnosis, evaluation, and management for a variety of common diseases and disorders across major body systems. Prerequisite(s): Admission to and matriculation in the CCPA program.
2 Credits
Patient Assessment II is the second course in a four-part series focused on developing foundational clinical skills. The course introduces students to medical history taking, physical examination techniques, and core clinical reasoning skills. Students learn to integrate history and examination findings to guide diagnostic decision-making, formulate differential diagnoses, and outline management plans. Instruction also emphasizes effective oral case presentation and accurate documentation of patient encounters. This course features hands-on teaching labs to ensure students master essential physical examination and diagnostic skills. Prerequisite(s): Admission to and matriculation in the CCPA program.
2 Credits
PA Professional Practice II is the second course in a four-part series that expands the foundational framework for PA practice, providing a focus on the unique healthcare needs of geriatric patients alongside the development of patient-centered and culturally sensitive counseling skills. Students will learn to critically assess how factors such as culture, ethnicity, race, gender, sexual orientation, religion, and social determinants of health profoundly impact patient medical decisions and health outcomes. The course culminates in the creation of comprehensive patient education materials based on preventative care guidelines, while simultaneously emphasizing the improvement of essential professional skills, including the ability to apply continuous self-assessment and performance improvement for lifelong competence. Prerequisite(s): Admission to and matriculation in the CCPA program.
Term three (18 credit hours)
4 Credits
Clinical Science III is the third course in a four-part series that comprehensively integrates serving as the bridge between foundational medical sciences with their application to clinical practice. This course reinforces and expands students’ knowledge of genetics, microbiology, anatomy, physiology, and pathophysiology across major organ systems. Students will relate physiological and pathophysiological processes to patient history, physical exam findings, and diagnostic studies. The course also builds on foundational pharmacology and pharmacotherapeutic concepts, with continued emphasis on selecting, initiating, and monitoring pharmacologic treatment. Prerequisite(s): Admission to and matriculation in the CCPA program.
6 Credits
Clinical Medicine III is the third course in a four-part system-based series designed to introduce and build core clinical reasoning skills. Building upon Clinical Medicine I-II, students further develop their ability to integrate medical history, physical exam findings, and diagnostic study results with expanding medical knowledge to evaluate increasingly complex clinical presentations. Emphasis is placed on refining differential diagnoses, formulating and implementing evidence-based treatment plans, including pharmacologic therapies, providing appropriate patient education and referrals, and incorporating preventive health screenings. The course deepens students’ understanding of the epidemiology, etiology, pathophysiology, clinical presentation, diagnosis, evaluation, and management for a variety of common diseases and disorders across major body systems. Prerequisite(s): Admission to and matriculation in the CCPA program.
3 Credits
Patient Assessment III is the third course in a four-part series focused on developing foundational clinical skills. The course introduces students to medical history taking, physical examination techniques, and core clinical reasoning skills. Students learn to integrate history and examination findings to guide diagnostic decision-making, formulate differential diagnoses, and outline management plans. Instruction also emphasizes effective oral case presentation and accurate documentation of patient encounters. This course features hands-on teaching labs to ensure students master essential physical examination and diagnostic skills. Prerequisite(s): Admission to and matriculation in the CCPA program.
2 Credits
PA Professional Practice III is the third course in a four-part series that presents and explores the framework for Physician Assistant practice, focusing on the practical integration of professional and ethical skills into patient care. Students will examine the principles of medical ethics and apply patient-centered care within interprofessional teams, while developing an understanding of the diverse roles and responsibilities of other healthcare professionals. A focus is placed on managing patients affected by violence, as well as mastering specialized skills for managing pediatric patients, including performing developmentally appropriate screening and applying core immunization principles across childhood stages. Throughout the course, students will develop patient education skills relevant to systems covered in the curriculum and utilize self-assessment to identify knowledge gaps and demonstrate a commitment to continuous professional improvement. Prerequisite(s): Admission to and matriculation in the CCPA program.
3 Credits
Technical Skills & Preparation for Clinical Practice I is the first course in a two-part series designed to build the foundational procedural and clinical application skills required for supervised clinical practice experiences. This course integrates hands-on training with applied clinical reasoning to determine the appropriate selection, indications, and contraindications for core medical procedures. Simulation-based learning, case scenarios and task trainers provide structured practice in aseptic technique, sterile field management, point-of-care assessments, and procedural performance. The course also emphasizes effective communication, including informed consent and aftercare, accurate documentation, interprofessional teamwork, and professionalism within fast-paced clinical environments. Prerequisite(s): Admission to and matriculation in the CCPA program.
Term four (17 credit hours)
4 Credits
Clinical Science IV is the final course in a four-part series that comprehensively integrates foundational medical sciences with their application to clinical practice. Building upon Clinical Science I-III, the course reinforces and deepens student understanding of genetics, microbiology, anatomy, physiology, and pathophysiology across major organ systems. Students apply physiological and pathophysiological concepts to patient history, physical examination findings, and diagnostic studies for increasingly complex cases and scenarios. The course furthers the development of foundational pharmacology and pharmacotherapeutics principles, including the selection, initiation, and monitoring of pharmacologic treatment. Additional emphasis is placed on quality improvement and systems-based practice to support readiness for supervised clinical practice experiences. Prerequisite(s): Admission to and matriculation in the CCPA program.
4 Credits
Clinical Medicine IV is the final course of a four-part system-based series and integrates the full range of clinical reasoning, diagnostic evaluation, and patient management skills developed throughout the curriculum. Students apply advanced medical knowledge to increasingly complex clinical presentations, further refining their ability to synthesize medical history, physical exam findings, and diagnostic study results to determine the most likely diagnosis. Emphasis is placed on selecting and implementing appropriate evidence-based treatment plans, including pharmacologic therapies, identifying indications for referral, and providing appropriate patient education. The course reinforces students’ understanding of the epidemiology, etiology, pathophysiology, clinical presentation, diagnosis, evaluation, and management for a variety of common diseases and disorders across major body systems in preparation for supervised clinical practice. Prerequisite(s): Admission to and matriculation in the CCPA program.
3 Credits
Patient Assessment IV is the fourth course in a four-part series focused on developing foundational clinical skills. The course introduces students to medical history taking, physical examination techniques, and core clinical reasoning skills. Students learn to integrate history and examination findings to guide diagnostic decision-making, formulate differential diagnoses, and outline management plans. Instruction also emphasizes effective oral case presentation and accurate documentation of patient encounters. This course features hands-on teaching labs to ensure students master essential physical examination and diagnostic skills. Prerequisite(s): Admission to and matriculation in the CCPA program.
3 Credits
PA Professional Practice IV is the final course in a four-part series that presents and explores the framework for PA practice. This course prepares students to integrate core competencies in patient safety and quality improvement with practical aspects of the business of medicine, including medical coding, billing, and documentation. Students will strengthen their understanding of modern healthcare delivery by exploring the applications, advantages, and risks of telehealth, telemedicine, and artificial intelligence in practice. A major focus will be placed on psychiatric conditions, preparing learners to recognize clinical findings, select and interpret diagnostic studies, formulate differential diagnoses, create comprehensive management plans, and pertinent patient education. Finally, the course emphasizes continuous professional improvement through self-assessment and demonstrates a commitment to continuous professional improvement. Prerequisite(s): Admission to and matriculation in the CCPA program.
3 Credits
Technical Skills & Preparation for Clinical Practice II is the second course in a two-part series designed to build foundational procedural and clinical application skills required for supervised clinical practice experiences. Building on Technical Skills & Preparation for Clinical Practice I, the course provides hands-on training and progressive application of clinical reasoning for selecting and performing core medical procedures. Simulation-based learning, case scenarios, and task trainers are used to practice procedures in increasingly complex situations, integrating point-of-care assessments, aseptic technique, and sterile field management. The course further develops students’ knowledge and skills in communication, informed consent, aftercare instructions, documentation, interprofessional collaboration, and professionalism within fast-paced clinical environments. Prerequisite(s): Admission to and matriculation in the CCPA program.
The course schedule for the clinical year (terms 5-8) consists of the following for a total of 44 credit hours.
Terms 5-8 (44 credit hours)
5 Credits
Community Medical Experience I is the first in a seven-course series offered during the clinical year. Students will study the science and practice of medicine across one of seven clinical experiences (Family Medicine, Internal Medicine, Pediatrics, Behavioral Health, Women’s Health, Surgery, and Emergency Medicine) in Community Health Centers and partnered hospital settings. Instruction occurs through Supervised Clinical Practice Experiences, self-directed study, synchronous and asynchronous learning, course assignments, and metacognitive reflection. Students will integrate knowledge from prior and concurrent coursework while learning alongside Clinical Preceptors. Supervised Clinical Practice Experiences will prepare students to care for patients across the lifespan in preventive, acute, chronic, and emergent settings, provide prenatal and gynecologic care, and manage surgical and behavioral health conditions. Prerequisite(s): Admission to and matriculation in the CCPA program and successful completion of didactic coursework.
5 Credits
Community Medical Experience II is the second in a seven-course series offered during the clinical year. Students will study the science and practice of medicine across one of seven clinical experiences (Family Medicine, Internal Medicine, Pediatrics, Behavioral Health, Women’s Health, Surgery, and Emergency Medicine) in Community Health Centers and partnered hospital settings. Instruction occurs through Supervised Clinical Practice Experiences, self-directed study, synchronous and asynchronous learning, course assignments, and metacognitive reflection. Students will integrate knowledge from prior and concurrent coursework while learning alongside Clinical Preceptors. Supervised Clinical Practice Experiences will prepare students to care for patients across the lifespan in preventive, acute, chronic, and emergent settings, provide prenatal and gynecologic care, and manage surgical and behavioral health conditions. Prerequisite(s): Admission to and matriculation in the CCPA program and successful completion of didactic coursework.
5 Credits
Community Medical Experience III is the third in a seven-course series offered during the clinical year. Students will study the science and practice of medicine across one of seven clinical experiences (Family Medicine, Internal Medicine, Pediatrics, Behavioral Health, Women’s Health, Surgery, and Emergency Medicine) in Community Health Centers and partnered hospital settings. Instruction occurs through Supervised Clinical Practice Experiences, self-directed study, synchronous and asynchronous learning, course assignments, and metacognitive reflection. Students will integrate knowledge from prior and concurrent coursework while learning alongside Clinical Preceptors. Supervised Clinical Practice Experiences will prepare students to care for patients across the lifespan in preventive, acute, chronic, and emergent settings, provide prenatal and gynecologic care, and manage surgical and behavioral health conditions. Prerequisite(s): Admission to and matriculation in the CCPA program and successful completion of didactic coursework.
5 Credits
Community Medical Experience IV is the fourth in a seven-course series offered during the clinical year. Students will study the science and practice of medicine across one of seven clinical experiences (Family Medicine, Internal Medicine, Pediatrics, Behavioral Health, Women’s Health, Surgery, and Emergency Medicine) in Community Health Centers and partnered hospital settings. Instruction occurs through Supervised Clinical Practice Experiences, self-directed study, synchronous and asynchronous learning, course assignments, and metacognitive reflection. Students will integrate knowledge from prior and concurrent coursework while learning alongside Clinical Preceptors. Supervised Clinical Practice Experiences will prepare students to care for patients across the lifespan in preventive, acute, chronic, and emergent settings, provide prenatal and gynecologic care, and manage surgical and behavioral health conditions. Prerequisite(s): Admission to and matriculation in the CCPA program and successful completion of didactic coursework.
5 Credits
Community Medical Experience V is the fifth in a seven-course series offered during the clinical year. Students will study the science and practice of medicine across one of seven clinical experiences (Family Medicine, Internal Medicine, Pediatrics, Behavioral Health, Women’s Health, Surgery, and Emergency Medicine) in Community Health Centers and partnered hospital settings. Instruction occurs through Supervised Clinical Practice Experiences, self-directed study, synchronous and asynchronous learning, course assignments, and metacognitive reflection. Students will integrate knowledge from prior and concurrent coursework while learning alongside Clinical Preceptors. Supervised Clinical Practice Experiences will prepare students to care for patients across the lifespan in preventive, acute, chronic, and emergent settings, provide prenatal and gynecologic care, and manage surgical and behavioral health conditions. Prerequisite(s): Admission to and matriculation in the CCPA program and successful completion of didactic coursework.
5 Credits
Community Medical Experience VI is the sixth in a seven-course series offered during the clinical year. Students will study the science and practice of medicine across one of seven clinical experiences (Family Medicine, Internal Medicine, Pediatrics, Behavioral Health, Women’s Health, Surgery, and Emergency Medicine) in Community Health Centers and partnered hospital settings. Instruction occurs through Supervised Clinical Practice Experiences, self-directed study, synchronous and asynchronous learning, course assignments, and metacognitive reflection. Students will integrate knowledge from prior and concurrent coursework while learning alongside Clinical Preceptors. Supervised Clinical Practice Experiences will prepare students to care for patients across the lifespan in preventive, acute, chronic, and emergent settings, provide prenatal and gynecologic care, and manage surgical and behavioral health conditions. Prerequisite(s): Admission to and matriculation in the CCPA program and successful completion of didactic coursework.
5 Credits
Community Medical Experience VII is the seventh in a seven-course series offered during the clinical year. Students will study the science and practice of medicine across one of seven clinical experiences (Family Medicine, Internal Medicine, Pediatrics, Behavioral Health, Women’s Health, Surgery, and Emergency Medicine) in Community Health Centers and partnered hospital settings. Instruction occurs through Supervised Clinical Practice Experiences, self-directed study, synchronous and asynchronous learning, course assignments, and metacognitive reflection. Students will integrate knowledge from prior and concurrent coursework while learning alongside Clinical Preceptors. Supervised Clinical Practice Experiences will prepare students to care for patients across the lifespan in preventive, acute, chronic, and emergent settings, provide prenatal and gynecologic care, and manage surgical and behavioral health conditions. Prerequisite(s): Admission to and matriculation in the CCPA program and successful completion of didactic coursework.
2 Credits
Transition to Practice I is the first in a series of two courses covering PANCE preparation and professional practice topics, including but not limited to credentialing, laws and regulations regarding professional practice and conduct, licensure and certification, the PA relationship with the physician and other health care providers, policy issues that affect practice, and professional organizations. Instruction occurs primarily through self-directed study, synchronous learning, assignments, and metacognitive reflection.
4 Credits
Transition to Practice II is the second in a series of two courses covering PANCE preparation and professional practice topics, including but not limited to credentialing, laws and regulations regarding professional practice and conduct, licensure and certification, the PA relationship with the physician and other health care providers, policy issues that affect practice, and professional organizations. Instruction occurs primarily through self-directed study, synchronous learning, assignments, and metacognitive reflection. Prerequisite(s): Admission to and matriculation in the CCPA program and successful completion of didactic coursework.
1 Credit
Clinical Seminar I is the first of a three course series designed to provide guided self-directed learning for students. The course is designed to ensure continual coverage of clinical and medical knowledge and behaviors, with the aim of maximizing knowledge retention through formative assessments. The course provides a platform for continued guidance and open communication between the student and the program faculty. Prerequisite(s): Admission to and matriculation in the CCPA program and successful completion of didactic coursework.
1 Credit
Clinical Seminar II is the second of a three course series designed to provide continuous guided self-directed learning for students. The course is designed to ensure ongoing coverage of clinical and medical knowledge and behaviors, with the aim of maximizing knowledge retention through ongoing formative assessments. The course provides a platform for continued guidance and open communication between the student and the program faculty. Prerequisite(s): Admission to and matriculation in the CCPA program and successful completion of didactic coursework.
1 Credit
Clinical Seminar III is the final of a three course series designed to provide continuous guided self-directed learning for students. The course is designed to provide continued coverage of clinical and medical knowledge and behaviors, with the aim of maximizing and refining knowledge retention through formative assessments. The course provides a platform for continued guidance and open communication between the student and the program staff. Prerequisite(s): Admission to and matriculation in the CCPA program and successful completion of didactic coursework.
Industry leading PA faculty
ATSU faculty for the Central Coast Physician Assistant program are all experts in the healthcare field and provide responsive and engaged support to all CCPA students. Our faculty maintains a rigorous curriculum that offers CCPA students entry to the physician assistant profession and fosters lifelong learning.
Hear from our leadership and faculty

Jennifer Harrington, DMS, PA-C, DFAAPA
Department Chair, Program Director, and Professor
Jennifer Harrington, DMS, PA-C, DFAAPA, has over 26 years of clinical experience and 17 years of PA educational experience, and has held pivotal roles in professional leadership, advocacy, and PA educational research. She has used her clinical skills to care for underserved patients in homeless areas, a community health center in rural Appalachia, inner-city regions, and developing countries, and has educated over 1,400 currently practicing PAs.
In PA education, she has held roles such as didactic director, interprofessional education coordinator, international medical outreach leader, student government advisor, academic coordinator, accreditation specialist, and program director. She enjoys developing innovative PA curricula and is currently researching the effectiveness of a curriculum she designed to increase proclivity for serving medically underserved patients.
Dr. Harrington has spoken at state, national, and international conferences, has had medical writing and research published in medical books and journals, has been a guest speaker on medical podcasts, has served as an AAPA House of Delegates Representative, has served in the PA Foundation’s Nutritional Outreach Fellowship, and was selected to be an AAPA Distinguished Fellow, an honor awarded to fewer than 2% of PAs. As a student, Dr. Harrington spent a semester in Papua New Guinea doing medical missions at a rural hospital and also went on a summer medical outreach to Malaysian villages. She later developed her own non-profit international medical outreach program through which over 11,000 patients in Peru, Guatemala, Nicaragua, and Honduras have been treated and over 180 PA students and medical providers have participated.
Awards
- 2023 PA Mom of the Year, awarded for being, “a tireless advocate for the underserved, a transformative educator, and a beacon of leadership and service at home and in her global community.”
- AAPA Distinguished Fellow, awarded in July 2022 for exceptional contributions to the PA profession.
- Outstanding Academic Leadership Award, awarded in 2020 for, “strong clinical knowledge, extensive involvement in and contributions to academia, an ongoing desire to improve education, evidence of a constant pursuit of educational excellence, and a willingness to serve students.”
- Kentucky Mother of the Year, awarded April 2017 by American Mothers Inc. for, “providing an inspiration of a mother’s unconditional love, inner strength, service to others, and courage.”
- Pi Alpha–PA National Honorary Society, awarded in 2016 by the PAEA for, “demonstrating a lifelong commitment to learning applied to benefit others.”
- PA Excellence in Service Award, awarded in 2012 for, “significant contributions of unconditional service to students and faculty.”

Andrea Perkins, MS
Director of Assessment
Andrea Perkins, MS, is the director of assessment for the CCPA program. She holds a Master of Research Methods in Education from the University of Kentucky and is currently progressing towards her PhD in Education Sciences. Andrea has worked in academia for over 13 years and joined ATSU in December 2024. She enjoys working in program evaluation and assisting programs on their path to program improvement.

Jeffrey Owens, DMSc, PA-C
Director of Clinical Education & Operations
After graduating from PA school in 2014, Jeffrey Owens, DMSc, PA-C, began his clinical career in emergency medicine before moving into trauma surgery and later orthopedic spine surgery. He served as lead PA in the Trauma Surgery Department at Jefferson Health in Philadelphia and has remained clinically active throughout his career, continuing to practice part-time in trauma surgery.
Dr. Owens transitioned into academia in 2017 and has nearly a decade of experience in PA education across multiple institutions. He has held faculty and leadership roles at Thomas Jefferson University, Lincoln Memorial University, and Drexel University, where he served as department chair and program director. His work in PA education has focused on curriculum innovation, clinical site and preceptor development, accreditation compliance, and faculty mentorship.
Education
Dr. Owens earned a Bachelor of Science in Interdisciplinary Studies from the University of Central Florida in 2011, a Master of Science in Physician Assistant Studies from Philadelphia University in 2014, and a Doctor of Medical Science with a concentration in Physician Assistant Education from the University of Lynchburg in 2020.
Nathan M. Setka, DMS, PA-C
Director of Didactic Education
Nathan M. Setka, Major (Ret.), DMS, PA-C, and assistant professor, has over two decades of military and civilian clinical experience and extensive experience in PA education. He has provided patient care across a wide range of settings, including emergency medicine, otolaryngology, family medicine, aeromedical medicine, and urgent care.
In PA education, he has held leadership roles such as didactic principal faculty and director of didactic education, where he continues to mentor and train future healthcare professionals. His military career includes service as Battalion PA, Brigade APA, and TMC OIC, with numerous deployments reflecting his leadership and dedication.
Dr. Setka holds board certification from the NCCPA, is licensed in Georgia, and is an active member of AAPA, GAPA, PAEA, and SAPA. He has completed advanced military medical training in areas such as emergency medicine, operational emergency medical skills course, aeromedical flight course, flight enroute care course, and tropical medicine course. His career reflects a steadfast commitment to excellence in patient care, PA education, and service to both civilian and military communities.
Education
- DMS, Lincoln Memorial University (2024)
- MPAS, University of Nebraska Medical Center (2006)
- BS, Ball State University (1999)

Natali Ortiz
Executive Assistant to the Dean
Natali Ortiz is an administrative assistant for A.T. Still University, CCPA Program. She recently joined ATSU in the Summer of 2023, bringing over 10 years of experience in administrative services with the American Red Cross. She also supported volunteer and disaster services, establishing community outreach specifically within the Spanish-speaking community, creating partnerships and serving those in need. In 2005, Hurricane Katrina was her first experience working with victims of a natural disaster. This experience brought a passion for serving others. Natali transitioned into a supervisory role, managing health & safety instructors who taught lifesaving skills such as CPR and first aid, throughout Central/Southern California and Nevada.
Natali resides in her hometown of Santa Maria, where she obtained an associate degree in criminal justice and studied towards a major in social sciences. Her educational studies stemmed from an interest in helping and understanding troubled young adults.
Program faculty
Nate Setka
Director of Didactic Education
NEED BIO

Jeff Owens
Director of Clinical Education
NEED BIO

Sean Dunn
Assistant Professor
NEED BIO
Rachel Cole
Assistant Professor
NEED BIO
Joy Henderson
Assistant Professor
NEED BIO
Amanda Clark, MMSc, PA-C
Assistant Professor
Amanda Clark, MMSc, PA-C, is a board-certified physician assistant and educator with a strong background in clinical practice and graduate-level medical education. She has since dedicated her career to advancing both patient care and the training of future healthcare providers.
Her clinical experience spans the fields of gastroenterology, surgery, and acute care/family medicine. Building on this foundation, she transitioned into academia in 2021, where she enjoys curriculum design and student-centered teaching while still practicing in family medicine part-time. She was delighted to join the dedicated team at A.T. Still University in June 2025, where Professor Clark course directs Technical Skills I and II. She also participates in multiple other lectures, labs, and assessments throughout the didactic year while serving as chair of admissions. Her academic interests include PA education innovation, skills remediation, PA admissions, and preparing students for success in clinical rotations and the PANCE.
What she loves most about PA education is being able to witness the transformation and growth of a student as they enter such a rigorous program and then ultimately emerge on the other side stronger, smarter, and well-prepared to serve a diverse patient population with competence and (most importantly) compassion.
Education
- Bachelor of Arts in Spanish from Georgia College and State University in 2008
- Master of Medical Science in Physician Assistant Studies from Mercer University in 2012
Awards
- Phi Alpha
- Didactic Professor of the Year (Mercer University 2024, 2025)

Chelsey Cantwell, DMS, PA-C
Assistant Professor
Chelsey Cantwell, DMS, PA-C, has served in PA education over the last five years. Before that, she began her career as a physician assistant in orthopedic surgery, working at a level I trauma center in orthopedic trauma and elective foot and ankle surgery. Dr. Cantwell continues her clinical career in outpatient elective foot and ankle surgery, where she enjoys seeing patients in the clinic setting. She began her PA education career in 2020, where she found a passion in training the next generation of physician assistants.
Education
Dr. Cantwell holds a Doctor of Medical Science degree from Lincoln Memorial University School of Medical Sciences in Harrogate, TN. Her Master of Physician Assistant Studies degree is from University of the Cumberlands in Williamsburg, KY, and her undergraduate studies were completed at Milligan University in Elizabethton, TN. She continues her scholarship through multiple organizations such as the Physician Assistants in Orthopedic Surgery organization, the American Academy of Physician Associates, and the Tennessee Academy of Physician Assistants.
Stacy Chelf, PhD
Stacy Chelf, PhD
Stacy Chelf, PhD, holds a PhD in Clinical Anatomy and has spent the past nine years teaching gross and cross-sectional anatomy to medical, physician assistant, and graduate students. A classically trained anatomist with extensive cadaveric dissection experience, she brings a three-dimensional understanding of human structure and function into the classroom, preparing students to apply anatomy directly to clinical practice.
She is passionate about helping students build confidence in connecting anatomy to patient care through lectures, imaging review, and hands-on learning. She has also served as director of didactic education for the LMU-Knoxville PA program and as vice chair of the anatomy department at LMU-DCOM, where she led curriculum development, supported accreditation compliance, and advanced student success initiatives.
Her scholarship includes peer-reviewed publications, national and international conference presentations, and funded research in anatomy education, bone health, and osteopathic manipulative therapy.
Education and recognition
Dr. Chelf earned her PhD in Clinical Anatomy from Lincoln Memorial University–DeBusk College of Osteopathic Medicine, a Master of Science in Anatomical Science from Lincoln Memorial University, a Master of Arts in Instructional Leadership from Tennessee Technological University, and a Bachelor of Science in Biological Science, magna cum laude, from Lee University. She has been recognized with several honors, including First DCOM Faculty of the Month and induction into the Alpha Chi National College Honor Society.

Jacqualine Dancy, MPAS, PA-C
Associate Professor
Jacqualine Dancy, MPAS, PA-C, brings over 20 years of diverse clinical experience, having practiced in urgent care, occupational medicine, emergency medicine, and family practice. She has been incredibly fortunate to have had amazing mentors throughout her career and aspires to be that same guiding force for you during your PA education.
She has served as a preceptor for numerous PA and nurse practitioner (NP) students. Her favorite part of teaching is witnessing the transformation of students from being "nervous newbies" to proficient practitioners.
Professor Dancy is honored to be with the CCPA program at A.T. Still University and is excited to meet and learn more about you. To introduce you to her journey, she shares that becoming a physician assistant (PA) was truly a calling for her, not just a career.
Education
- California Polytechnic State University, Bachelor of Arts in Speech Communication (2000)
- University of California, Davis, Certificate of Completion, NP-PA Program (2003)
- University of Nebraska, School of Medicine, Master of Physician Assistant Studies (DLP-PA) (2006)
Melissa Day, DMS, MPAS, PA-C
Clinical Coordinator and Associate Professor
After graduation from PA school, Melissa Day, DMS, MPAS, PA-C, practiced clinically in family and internal medicine before transitioning full time into academia in 2016. Additionally, she has volunteered her time at an endocrinology office. Dr. Day spent four years in didactic education before moving into the clinical phase of PA education, where she has served as clinical coordinator and director of clinical education.
She really enjoys recruitment and retention of preceptors and clinical sites and seeing students mature into the student clinician role. She has been an active member of both the Tennessee Academy of Physician Assistants (TAPA) and the Kentucky Academy of Physician Assistants (KAPA), as well as the American Academy of Physician Assistants (AAPA) and the Physician Assistant Education Association (PAEA). She joined the ATSU Central California Physician Assistant Program in June 2024.
Education
Dr. Day holds a Bachelor of Arts degree from University of the Cumberlands in Williamsburg, KY, where she majored in biology and minored in chemistry and Spanish in 2009. She graduated with a Master of Science in Physician Assistant Studies in 2009 from University of the Cumberlands.
James Garrett, MPAS, PA-C
Assistant Professor
After graduating from PA school in 2013, James Garrett, MPAS, PA-C, began his clinical career in family medicine in rural West Texas. After moving back to his home state of Georgia, he practiced in emergency medicine for two years and has maintained clinical practice in Urgent Care Medicine for the past 10 years. James began serving as a clinical preceptor for numerous PA and NP students shortly after PA school and continued until transitioning to full-time academia in 2019. Prior to joining the ATSU CCPA program in October 2025, he served as principal didactic faculty at the Philadelphia College of Osteopathic Medicine PA program for six years. He enjoys mentoring the next generation of PAs during one of the most trying but rewarding times in their lives.
Education
James earned a Bachelor of Science in Biology from Kennesaw State University in 2005 and a Master of Science in Physician Assistant Studies from Texas Tech University Health Science Center in 2013.

Stephanie Hull, DMS, EdS, MMS, PA-C
Curriculum Committee Chair and Professor
Stephanie Hull, DMS, EdS, MMS, PA-C, has over 22 years of clinical experience and over 13 years of higher education experience. She started her career as a PA in emergency medicine in West Virginia. In addition to emergency medicine, she also worked in cardiac electrophysiology, hospital medicine, and urgent care. Dr. Hull began her higher education career at Lincoln Memorial University in rural east Tennessee. She was principal faculty for both the didactic and clinical teams, director of didactic education, and associate program director for the LMU-Harrogate PA program. She was the assistant dean and founding program director for the LMU-Knoxville PA program. Dr. Hull brings her knowledge of curriculum development and application of ARC-PA standards to the ATSU CCPA program. She currently works for a rural general surgery practice in east Tennessee and is principal faculty for the ATSU CCPA program.
Education
Dr. Hull completed her B.S. in Physician Assistant Studies at Pennsylvania College of Technology in Williamsport, Pennsylvania. She completed her MMS with a concentration in emergency medicine at Alderson-Broaddus University in Philippi, West Virginia. She completed her EdS and DMS at Lincoln Memorial University in Harrogate, Tennessee.
Mike Maricle, MPAS, PA-C
Assistant Professor
Mike Maricle, MPAS, PA-C, started as an emergency medical technician (EMT) in South Los Angeles in 2006. After an injury ended his 911 career, he spent nearly 10 years as a nocturnist physician assistant in the San Francisco Bay Area and Central Coast emergency departments. He’s had many wonderful mentors along the way and is looking forward to guiding and inspiring the next generation of PAs on their healthcare journeys.
Education
- Master of Science in Physician Assistant Studies, A.T. Still University
- Bachelor of Arts, cum laude, University of California
Chuck Merrill, MD
Associate Professor
Chuck Merrill, MD, worked as an emergency physician at St. Mary Medical Center in Long Beach, CA, and Marian Regional Medical Center in Santa Maria, both trauma centers and teaching hospitals. He was the teaching head in emergency medicine for the Internal Medicine Residency Program at St. Mary’s and was one of the founding fathers of Marian’s Family Medicine and Ob/Gyn Residency Programs. He served as the chief medical officer and as the designated institutional officer at Marian until June of 2025. Now free of administrative responsibilities, he wishes to share his knowledge and wisdom with the next generation.
Awards and Education
- BS, Biologic Sciences, University of Southern California
- MD, Washington University, St. Louis, MO
- Internship, Pediatrics, St. Louis Children's Hospital
- Residency, Emergency Medicine, Harbor/UCLA Medical Center, Los Angeles
- Board Certified, American Board of Emergency Medicine
- Fellow, American College of Emergency Physicians
- Oral Board Examiner, American Board of Emergency Medicine
Teah Nash, MSPAS, PA-C
Academic Coordinator and Assistant Professor
Teah Nash, MSPAS, PA-C, is a dedicated physician assistant with a career spanning over a decade. She began her educational journey at UC Santa Barbara with a Bachelor of Arts in Psychology in 2006 and then received a Master of Science in Physician Assistant Studies in 2013 from Western University of Health Sciences. Driven by a desire to further enhance her skills and increase her medical knowledge, Teah then undertook a 14-month Emergency Medicine Physician Assistant (EMPA) Fellowship at a level II trauma and burn center. Upon completion of the fellowship in 2014, Teah became a full-time staff PA at Arrowhead Regional Medical Center, where she further honed her emergency medicine skills while precepting the next fellowship cohort behind her.
In late 2015, Teah then moved to the Central Coast and joined MedStop Urgent Care in San Luis Obispo, CA. Through MedStop, Teah has evaluated and managed urgent care concerns, practiced occupational medicine, and performed certified medical examinations for commercial drivers.
Recognizing the importance of education and knowledge-sharing, Teah is now embarking on the next chapter in her career with A.T. Still University.
Education
- Master of Science in Physician Assistant Studies, Western University of Health Sciences (2013)
- Bachelor of Arts in Psychology, University of California – Santa Barbara (2006)

Edwin E. Nyambi, DMSc, MPAS, PA-C
Assistant Professor
Edwin E. Nyambi, DMSc, MPAS, PA-C, was born in Cameroon, Africa. He moved to the USA in 2004. He received an Associate of Science (A.S.) in prepharmacy at Albany State University (Albany, Georgia). He received a certificate in Diversity, B.S. in Biology, B.S. in Sociology, with a minor in Chemistry from the University of Utah (Salt Lake City, Utah). Dr. Nyambi completed his Master of Physician Assistant Studies (MPAS) at the University of Utah School of Medicine. He completed an internal medicine internship at the VA Medical Center (Salt Lake City, UT). He earned his Doctor of Medical Science (DMSc) degree, followed by fellowship training in general psychiatry, from the University of Lynchburg (Lynchburg, Virginia).
Dr. Nyambi has worked in psychiatry as a research assistant (2009-2014), psychiatric technician (2012-2018), and PA (2018-present) at the University of Utah Health (Huntsman Mental Health Institute), providing child, adolescent, and adult psychiatry consultations in the emergency department and OB emergency department.
Dr. Nyambi’s clinical and research interests include psychiatry crisis services, consultation-liaison psychiatry, outpatient psychiatry, and human genetics. Dr. Nyambi’s teaching interests are broad; he has taught the following courses over his professional career: anatomy, biochemistry, physiology, microbiology, pharmacology, and several clinical medicine specialty courses.
Awards
Dr. Nyambi has received several honors and awards throughout his academic and professional career, including: University of Utah PA Program Specialty Preceptor of the Year Award for class 54 (2025); Huntsman Mental Health Institute Undeniably Noble Individual (nominee, 2019); University of Utah Continuing Education Scholarship (2010); University of Utah Department of Psychiatry Undergraduate Summer Research Grant (2010); Phi Theta Kappa, Albany State University (2008); All-Georgia Academic Team (2008); Ken Allen Rodgers Outstanding Leader Award (2008); Honor’s Scholar Award, Albany State University (2008); Outstanding Student, Division of Science and Mathematics Award, Albany State University (2008); All-USA Academic Team (nominee, 2008); International Scholar Laureate Program, Albany State University (2007); National Dean’s List, Albany State University (2007); Who’s Who Among Students in American Junior Colleges (2007); and the HOPE Scholarship Award, Georgia Student Finance Commission (2006-2008).
Melissa Wiley, DMS, MSPAS, PA-C
Clinical Coordinator and Associate Professor
Melissa Wiley, DMS, MSPAS, PA-C, completed both her undergraduate and graduate studies at the University of Pittsburgh, earning a Bachelor of Science in Emergency Medicine in 2008 and a Master of Science in Physician Assistant Studies in 2011. After graduation from PA school, Dr. Wiley practiced clinically in orthopedic surgery before transitioning into academia in 2019.
Dr. Wiley has dedicated herself to developing as a medical educator. In 2022, she earned a Doctor of Medical Science, with a focus in Medical Education, from Lincoln Memorial University. She has dedicated two years to didactic instruction, with the remainder of her academic career focused on the clinical phase. Having worked on both the didactic and clinical sides, she has had the opportunity to course and block direct across multiple courses and provide student mentorship to both didactic- and clinical-phase students.
She enjoys recruitment and retention of preceptors and clinical sites. She is passionate about missions and serving the medically underserved. She has been an active member of the Tennessee Academy of Physician Assistant (TAPA), as well as the American Academy of Physician Assistants (AAPA), and the Physician Assistant Education Association (PAEA). She joined the ATSU Central Coast Physician Assistant Program in September 2024.
Awards
- Lincoln Memorial University School of Medical Science Employee of the Month (June 2023)
- Lincoln Memorial University Doctor of Medical Science Class of 2021 Outstanding
- Academic Leader Award
Adjunct faculty
Arlene Salmon, MMSc, MBA, PA-C
Adjunct Professor
Arlene Salmon MMSc, MBA, PA-C, graduated from the United States Air Force Academy and went on to serve as a command pilot for over 20 years, flying both the T-38 and C-130 aircraft. After retiring from military service, Arlene pursued a career in medicine, earning a Master of Medical Science degree in Physician Assistant Studies from Mercer University in Georgia. Following graduation, she worked in family practice and then transitioned into emergency medicine while also quickly returning to Mercer as a faculty member. It was at Mercer where she developed a passion for teaching future generations of physician assistants.
Arlene joined ATSU in June 2025, bringing both her academic and clinical expertise to the Central Coast Physician Assistant (CCPA) program. In addition to her current teaching responsibilities, she practices as a physician assistant in a busy emergency department in Atlanta, Georgia, which allows her to bring real-world clinical experiences into her instruction. In her free time, she enjoys exercising and spending time with her husband of 33 years, Scott, and their three children Ryan, Kendall, and Mason.
Katharine Sanchez, DMSc, PA-C
Adjunct Professor
NEED BIO
Efren Torres, MSPAS, PA-C, ’24
Adjunct Professor
NEED BIO
Gregg Ales, DO
Adjunct Professor
NEED BIO

Yelena Gimelberg, MSPAS, MPH, PA-C
Adjunct Professor
NEED BIO
Khoa Tran, MPAS, PA-C
Adjunct Professor
NEED BIO
Alexis Hada, MMSc, PA-C
Adjunct Professor
NEED BIO
Brady Van Beurden, MSPAS, PA-C
Adjunct Professor
NEED BIO
Cheri Jrolf, DMSc, MPAS, PA-C, ’22
Adjunct Professor
NEED BIO
Brandy Brooks, EdD, MHS, PA-C
Adjunct Professor
Before Brandy Brooks, EdD, MHS, PA-C, became a physician assistant, she worked as a physical therapy aide for multiple years. She believes this made her well-rounded and where she started to learn the art of collaboratively building trusting and caring relationships with patients. After graduation, she decided to go into family practice & sports medicine at a community hospital in Olympia, WA. She learned quickly to work effectively and efficiently, spending adequate time with each patient and treating them as she would hope a family member would be treated.
As her patient panel continued to grow and became very diverse, she additionally accepted a leadership role in the clinic administration. She was honored to sit on the Capital Medical Center Network Operations Council for Physician Governance Board for two years as the only advanced practice practitioner on the board. She then moved into aesthetic cosmetic and medical dermatology in Bakersfield, CA, and rose to the clinical supervisor for two medical cosmetic spas, performing many diverse procedures daily, as well as conducting medical clearances for all patients.
Dr. Brooks is a proud member of the LGBT Physician Assistant Caucus and has worked heavily in transgender medicine throughout her career. Her desire to help throughout all walks of her community is very important to her, as well as performing research on these topics. Of extreme importance to Dr. Brooks is to help stop sex trafficking, as well as help medical professionals be trained and confident to identify and treat victims. Her research, “The Need for a Mandatory Sex Trafficking Component in Physician Assistant Education”, was published in the Journal of Physician Assistant Education in 2021. She continued to work to combat and educate on sex trafficking throughout the nation, and the responsibility of medical professionals in this patient population. She is also a member of the Bakersfield Junior League.
Education
Dr. Brooks is a 2012 graduate of Saint Martin’s University in Lacey, WA, where she was a Division II NCAA softball student-athlete and graduated with a biology degree. She then continued her education at South College in Knoxville, TN, where she received her Master of Health Science and was inducted into the Phi Alpha Honor Society for the Physician Assistant Profession. In 2019, she completed her Doctor of Education in Health Professions from A.T. Still University. She believes that education should never stop and thus strives to be a lifelong learner personally and professionally.
Jarrod Harbour, DHSc, MBA, PA-C
Adjunct Professor
Born in a rural area of Arizona, Jarrod Harbour, DHSc, MBA, PA-C, graduated with a Master’s in Physician Assistant Studies at A.T. Still University’s Arizona School of Health Sciences in 2015. During his time in the program, he did his clinical rotations in Central Valley, California, in a community health center. He loved the concept of the community health centers and the impact on the underserved; Dr. Harbour decided to become a family practice PA for the organization.
As a practitioner, he would go on to be a preceptor to several students and be involved in the organization’s subcommittees. In 2018, he was promoted to assistant medical director for the community health center, where he would oversee 6 different clinics in the area. In 2022, Dr. Harbour was promoted to Director of Walk-In and Special Services.
His accomplishments go beyond into the community, including creating the first MAT clinic in Tulare County to help combat opioid and alcohol dependence. Dr. Harbour wanted to give back to education by accepting a position as Regional Director of Medical Education (RDME) in 2019, where he would organize clinical rotations and provide educational activities for second-year PA students. In 2021, Dr. Harbour was chosen as the RDME of the year by A.T. Still University.
He continues to be a lifelong student, as Dr. Harbour has received his Doctor of Health Science degree with a concentration in leadership and organizational behavior in 2021. He graduated with his MBA in healthcare management in 2022 and is currently pursuing his MHA, pending graduation in 2024.

Phil DaVisio, DMSc, PA-C, CAQ-EM
Adjunct Professor
Phil DaVisio, DMSc, PA-C, CAQ-EM, was born and raised in Denver, Colorado. His career in medicine began in 1989. Over the next decade, Dr. DaVisio worked as a field paramedic, field instructor, flight paramedic, and ultimately clinical services director for a 911 ambulance operation until he decided to enter the PA profession.
In 2004, Dr. DaVisio graduated from the Kettering College PA program and began working in emergency medicine in Stockton, CA. He ultimately stayed at that facility full time for 12 years, during which he worked his way up the ranks to site APC director and regional APC director, ultimately functioning as the assistant ED director. In 2016, Dr. DaVisio moved to Kaiser Permanente in the South Sacramento emergency department full time, and shortly after, he was named lead APC for the facility, working with PAs in eight departments. In 2019, Dr. DaVisio completed his MSPAS through ATSU and, in 2021, completed his DMSc through the University of Lynchburg. Dr. DaVisio also completed his CAQ in emergency medicine in 2011 and recently recertified it.
In addition to clinical work, in 2018, Dr. DaVisio was elected to a director-at-large position with the Society of Emergency Medicine Physician Assistants and was recently elected to president-elect, with his term ending in 2024. Dr. DaVisio also serves on several committees with his current employer and SEMPA.

Jennifer Owen, MPAS, PA-C
Adjunct Professor
Jennifer Owen, MPAS, PA-C, is a physician assistant with 14 years of experience in clinical practice. She's always had a passion for taking care of people and wanting to help others. She is a local to the Central Coast and is happy to be able to give back to the community she grew up in.
She earned her Bachelor of Science degree in Kinesiology, with an emphasis in athletic training, at Cal State Fullerton in 2005. She then worked as an athletic trainer at Righetti High School in Santa Maria, California, for two years. Jennifer wanted to be more involved in inpatient care and disease prevention and decided to return to PA school.
Jennifer attended Rocky Mountain College, Master of Physician Assistant program, in Billings, Montana. She graduated in 2010 and was fortunate enough to move back to the Central Coast. She started her PA career in urgent care medicine and then family practice for the first seven years. For the last seven years, she has been practicing in allergy, asthma, immunology. She is very happy to be helping improve patients’ quality of life with the treatment of their allergies. She is excited to be part of an area of medicine that continues to evolve and advance. Jennifer is excited to expand her career by joining the ATSU PA program as adjunct faculty, helping to teach and prepare new PA students.

Shauna Lynch, DO, JD, AOBFP, ABOIM, ABIHM
Adjunct Professor
Shauna Lynch, DO, JD, AOBFP, ABOIM, ABIHM, is a dual board-certified integrative and family practice physician who is trained in traditional western medicine and also trained to take a holistic view of the body. Her integrative, complementary, and functional medicine approach has allowed her to delve deeper into the root causes of medical symptoms. This patient-centered focus facilitates her customized and personalized care plans for her patients. She focuses in on preventative lifestyle changes such as diet, exercise, herbal supplements, nutraceutical supplements, and, when appropriate, prescription pharmaceuticals.
Dr. Lynch obtained her Bachelor of Arts in Biology and Psychology from Merrimack College in North Andover, MA. She completed her Doctor of Osteopathic Medicine degree (DO) from Western University of Health Sciences in Pomona, CA. Dr. Lynch performed her internship and residency in family practice at Kingman Regional Medical Center in Arizona. She completed her Doctor of Jurisprudence (JD) in 2023 from the San Luis Obispo College of Law.
She has been CEO and medical director for two medical corporations on the Central Coast. She has held several supervising roles, reviewing and auditing charts and consulting with physician assistants and nurse practitioners in family practice and urgent care settings. She has also performed medicolegal chart reviews for attorneys. She is looking forward to entering academia.
Credentials
- Board-certified Family Practice physician (AOBFP)
- Board-certified Integrative Medicine (ABPS)
- Doctor of Jurisprudence (2023)
- Additional certification in Integrative and Holistic Medicine (ABIHM)
- Fellowship in Metabolic and Nutritional Medicine (A4M)
- Urgent care/Occupational experience
- Licensed in the state of California and Hawaii
Joseph Carter, DMSc, PA-C
Adjunct Professor
Joseph Carter, DMSc, PA-C, began his career with the U.S. Army, where he served in various leadership roles, eventually transitioning to healthcare. After earning his Master of Physician Assistant Studies from the military’s Interservice Physician Assistant Program, Dr. Carter began working in a variety of settings, including orthopedics, spine surgery, family practice, and urgent care.
Dr. Carter has extensive experience in clinical leadership, having served as the Medical Clinic Administrator at the Santa Ynez Tribal Health Clinic, where he was responsible for the operational leadership of the medical department. During his tenure, he implemented patient-centered care teams, improved productivity, and expanded access to specialty care services. He is currently working full-time at Cottage Health Urgent Care.
Education
Dr. Carter holds a Doctor of Medical Science degree from Rocky Mountain University of Health Professions, and he continues to enhance his expertise through ongoing certifications, including a Child and Adolescent Psychiatry Fellowship, a certificate in Obesity Management in Primary Care, and a Point of Care Ultrasound in Primary Care Fellowship. He has lectured at AAPA national conferences on topics such as family practice management of spine injuries, clinical skills, and primary care ultrasound.
Tina Kibodeaux
Program Manager, Central Coast PA Program
Tina Kibodeaux hails from Texas and served in the Navy, spending most of her tour of duty in Washington, D.C., with the White House Communications Agency. After her service, she fulfilled a long-time dream by moving to California. In Los Angeles, she leveraged her technical and organizational skills at an advertising agency before relocating to Santa Maria. Tina joined A.T. Still University in 2019, contributing to the early development of the Central Coast PA Program.
Adolfo Ortiz, MS
Learning Specialist, Student Affairs
Adolfo Ortiz, MS, was born in Morelia, Mexico, and moved to King City, CA, when he was 5 years old. He attended California State University, Long Beach, where he pursued his undergraduate studies in psychology. After completing his Bachelor of Arts degree, Adolfo embarked on a year of service with AmeriCorps, dedicating his time and expertise to AltaMed in the Los Angeles and Orange County areas, where he played a vital role in community health initiatives, working with at-risk youth at local high schools and clinics.
Driven by a passion for helping students achieve their educational and personal goals, he pursued further education, earning a master's degree in higher education counseling and student affairs at Cal Poly San Luis Obispo. His dedication to supporting students' academic journeys led him to the College of Business at Cal Poly as an academic advisor. In November 2021, Adolfo joined the ATSU community with the CCPA program. Adolfo’s commitment to education and service exemplifies his unwavering dedication to helping others thrive by empowering students to reach their full potential.

Jessica McFadden
Didactic Education Manager
Jessica McFadden was born in Orangeburg, South Carolina, and was raised in Columbia, South Carolina. After completing high school, she enlisted in the U.S. Air Force as a Security Forces member and held many titles ranging from Response Force Leader to Crime Prevention Program Manager. During her time in service, Jessica began her bachelor’s degree in healthcare administration at Grand Canyon University (online), which continued to fuel her love for the healthcare field. Once completing her six years of service, Jessica wanted to delve deeper into the world of healthcare and health education.
In September 2023, Jessica joined the ATSU team with the Central California Physician Assistant program. Jessica’s strong passion for the healthcare field drives her commitment to providing valuable support to the clinical students as they embark on a new chapter of their PA journey.

Lisett Hernandez
Clinical Education Manager
Lisett Hernandez’s journey has its roots firmly planted in the Santa Maria Valley, her hometown. Before embarking on her career in clinical education with ATSU, Lisett had a fulfilling position in the healthcare industry, specializing in labor and delivery. For eight years, she served as a scrub technician, and her role extended far beyond operating room duties. Lisett actively participated in assisting with all deliveries, showcasing her passion for supporting both mothers and newborns during their crucial moments.

Romelia Ker-Wolf
Clinical Education Specialist
Romelia “Mel” Ker-Wolf is a global citizen with a vibrant cultural background, born and raised on the lush island of Borneo in Malaysia. Her journey across several countries has shaped her colorful worldview and chameleon-like adaptability. Fluent in five languages and seven dialects, Mel thrives on meaningful conversations and building connections with people from all walks of life.
Mel joined ATSU in November 2024, bringing along 15 years of experience in education and six years in healthcare. Her extensive background has equipped her with a profound understanding of both fields, giving her a well-rounded perspective and a deep commitment to making a lasting impact in the lives of those she serves. Ever the lifelong learner, Mel is always on the lookout for fresh, innovative ways to grow and give back to her community.
Dot Winslow, MFA, BS, CAPF in training
Library Assistant, A.T. Still Memorial Library
Dot Winslow, MFA, BS, is the solo library assistant and the president of the Diversity in Education Committee California. She holds a Master of Fine Arts degree from Antioch University Los Angeles, and a Bachelor of Science degree in business administration with a minor in Italian from Saint Mary’s College of California. She is also a certified teacher in California Poets in the Schools and is training to become a Certified Applied Poetry Facilitator through the International Federation of BiblioPoetry Therapy. Dot is passionate about helping others and is honored to be able to help young professionals become caring providers.
Dot has lived on the Central Coast since 2012. Originally from the Bay Area, she is a SF Giants fan and enjoys trying new food. Dot has one red-eyed white rabbit named Rainbow and a California milk snake named Ridley, along with a husband and teen stepdaughter. Dot joined ATSU in April 2022, coming to the library profession from a background in sales in the electrical distribution industry.
Olivia Ross, BS
Admissions Counselor, A.T. Still University
Olivia Ross is the admissions counselor for the CCPA program. Born and raised on the Central Coast in California, she earned her degree in sociology from Chico State. During her time at Chico State, Olivia became involved on campus and discovered her true passion for helping students uncover their potential. Coming from a big family with parents who did not attend college, Olivia proudly became the first generation to graduate.
After completing her degree, Olivia briefly worked in plumbing sales before transitioning into her desired field of admissions and higher education. With a natural affinity for connecting with people, Olivia finds joy in meeting new individuals and assisting students in their journey of self-discovery and growth. As an admissions counselor for ATSU, Olivia's dedication and genuine care for students shine through. Her unique background and experiences provide her with a valuable perspective that allows her to guide students effectively. Olivia's enthusiasm and commitment to helping students reach their goals make her an invaluable asset to the university.

Evelyn Feliciano
Administrative Assistant, Didactic Year
Born and raised in New York City, Evelyn “Evie” Feliciano is of Puerto Rican descent and the proud oldest sibling in a vibrant family of seven. In 1991, she moved to California’s beautiful Central Coast, where she began her dedicated career with the County of Santa Barbara. Starting as an administrative assistant, she later took on roles as an eligibility worker for Medi-Cal, general relief, and as a case worker for California Children’s Services.
Evie joined ATSU in March 2024, bringing with her a wealth of experience and a strong commitment to serving her community. Notably, she was part of the first COVID team established by the County of Santa Barbara, playing a crucial role during the pandemic.
Cesar Chavez
IT Support Technician
Cesar Chavez is a Santa Maria native and dedicated IT support technician with a strong foundation in technology. With over a year of experience at A.T. Still University, he has a proven track record of providing excellent support to students and staff.
Prior to joining ATSU, he started his It career working for the IT department at Allan Hancock College as a student worker for five years, where he honed his technical skills and gained valuable experience in troubleshooting various hardware and software issues.

Jessica Ybarra
Clinical Administrative Assistant
Born and raised on the Central Coast, Jessica “Jess” Ybarra has spent over 16 years making a difference in healthcare. She began her career as a medical assistant for a family practice and addiction specialist, building a strong foundation in patient care. She then joined CHC of the Central Coast as a lean facilitator and later worked in the quality department, focusing on process improvement and quality assurance. At the County of San Luis Obispo, she served in the drug and alcohol department, supporting diverse populations with compassion and professionalism.
Now at A.T. Still University, Jessica draws on her extensive background in patient services, quality improvement, and healthcare operations, pairing technical expertise with a deep commitment to patient-centered care. Known for her approachable demeanor and collaborative spirit, she works to create an environment where everyone feels supported and teams can thrive.
Tuition and fees
Tuition and fees for the Central Coast Physician Assistant program are designed to cover the cost of high-quality education and essential student services. In addition to tuition, students are responsible for a student technology fee, which helps support access to critical student resources. Tuition rates and fees are subject to change, please review the tuition and fees breakdown for the most up-to-date information.
Financial aid
Investing in your future as a student is one of the most important steps you will take. ATSU can help you create a financially sound aid package that will let you focus on your education instead of worrying about how you will finance it. To learn more about your options, please visit Enrollment Services online or contact them at enrollmentservices@atsu.edu or 660.626.2019.
Admissions
The ATSU Central Coast PA Program seeks to recruit students whose personal goals and background are consistent with the Program’s mission. Students who are professional, culturally humble, and have a desire to serve diverse medically underserved populations are an optimal fit.
The Central Coast PA Program utilizes rolling admissions. Because applications are reviewed in the order they are received until the cohort is full, we strongly encourage early submission. Applying early significantly increases your window of opportunity for an interview invitation.
STEP 1: Apply through CASPA
Submit the following items via the CASPA Portal no later than the October 1 deadline for your desired application cycle.
- CASPA electronic application (sent through the CASPA portal)
- Three letters of recommendation (sent through the CASPA portal)
- Official transcripts (sent through the CASPA portal or directly to ATSU)
The CCPA Program reviews only those applications that have reached Verified status through CASPA. Achieving this status requires the successful submission of a complete application, all official transcripts, and three letters of recommendation. Only verified files advance to the formal applicant review process.
Applicants possessing a Hometown Scholar or ATSU MOU Partnership endorsement should submit the letter prior to the CASPA application or by October 31 of the desired application cycle. Endorsements received after this date will result in the applicant being ineligible for the Hometown Scholar or ATSU MOU Affiliate referral.
STEP 2: Secondary application and endorsement documents
Following the receipt of a verified CASPA application, the University admissions department emails a secondary application to candidates who meet the Program’s minimum admissions requirements. The secondary application and any applicable endorsement documents must be submitted by October 31 of the desired cycle to advance to the next stage of the CCPA Program review process.
STEP 3: Review of applicant materials and interview selection
The CCPA Program reviews all applicants who successfully submitted materials by the October 31 of each application cycle. Applicants are categorized as follows:
- Invite for interview: Candidates who demonstrate the highest potential for fulfilling the program’s mission are invited to interview early in the cycle.
- Hold for further review: Candidates with moderate mission alignment are held for continued consideration. These applicants may be invited to interview later in the cycle, with all final determinations made by the end of April.
- Declined for interview: Candidates whose goals and background do not align with the program’s mission are not invited to interview.
STEP 4: Participate in a virtual interview
The Zoom-based interview uses an MMI format, featuring a leadership Q&A and three individual faculty interviews. A webcam and microphone are required, though a personal Zoom account is not necessary.
STEP 5: Receive an admissions decision
Following interviews, the Admissions Committee evaluates scores to reach one of three initial decisions: (1) Offer Admission, (2) Hold for Further Review, or (3) Decline Admission. Applicants receive written notification typically within two weeks. By the end of the review cycle in April of each cycle, candidates on the "Hold" list receive a final status of admission, waitlist placement, or decline.
The Central Coast Physician Assistant Program is committed to selecting candidates dedicated to practicing culturally humble, primary care within medically underserved communities. As part of our holistic admissions process, we evaluate qualities that align with the program’s mission and indicate a high potential for student success. While no single factor guarantees admission, the program provides preference during the application review to candidates who demonstrate the following backgrounds:
- First-generation college students: Preference is given to applicants who are the first in their family to attend college.
- Patient care experience: While not required, medical experience is preferred. Special consideration is given to candidates with experience in medically underserved areas. This category applies to roles with direct patient care responsibility (e.g., Nurse, Paramedic, EMT, CNA, Phlebotomist, PT, or Dental Hygienist). Medical Assistant roles qualify if they involve direct patient care or clinical decision-making.
- Volunteer and community service: Preference is given to applicants who demonstrate an altruistic commitment to service, specifically those providing social services to disadvantaged or underserved populations.
- Economically disadvantaged background: Applicants from economically disadvantaged backgrounds are given preference in the holistic review process.
- Residents of the Central Coast Region: Applicants with verified addresses in Monterey, San Luis Obispo, Santa Barbara, or Ventura Counties receive additional consideration.
- ATSU Hometown Scholar: Applicants who meet all admission requirements and receive an official endorsement from their local community health center will receive an automatic invitation to interview. The endorsement letter must be submitted to the Hometown Scholars Coordinator (annmarierucker@atsu.edu) before the CASPA cycle closes to be eligible for the current cycle.
- Affiliate referrals (MOU): Applicants from institutions with a Memorandum of Understanding (MOU) who receive a formal endorsement are guaranteed an interview, subject to availability. Endorsements must be submitted before the CASPA cycle closes. Current affiliates include: Community Health Centers of the Central Coast, Lompoc Valley Medical Center, CSU Channel Islands, Cal Poly (SLO), and Santa Barbara Neighborhood Clinics.
Note: While no single factor listed above guarantees acceptance, each is carefully weighed as part of our commitment to a holistic application review.
Application Cycle: April 23, 2026 - October 1, 2026
To be considered for the 2026–2027 cycle, all applicants must meet the following criteria. Please ensure all documentation is submitted and verified by the closing deadline.
Degree requirements
All applicants must meet the following criteria regarding their undergraduate education to be eligible for the program.
- Minimum degree: Applicants must hold a Bachelor's degree or higher from a U.S. college or university accredited by a US Department of Education institutional accreditor.
- Completion deadline: Applicant degrees must be officially conferred no later than September 1, 2027.
-
Exclusions:
- The program does not accept degrees from international institutions.
- Reports: The program does not accept third-party transcript evaluations (such as WES or ECE) or equivalency reports for non-U.S. degrees. Only original transcripts from U.S.-accredited institutions will be considered.
Transcript submission and verification
To ensure a timely application review, please follow these submission guidelines:
- Official transcripts: All transcripts must be submitted directly via the CASPA portal for official verification.
- Direct review policy: The PA Program does not accept third-party credential evaluations or external equivalency reports. Our admissions committee performs an independent, internal review of all original coursework.
GPA and academic requirements
Applicants must meet the following minimum standards to be considered for admission. Please note that meeting these minimums does not guarantee an interview. Additionally, all official transcripts must be submitted directly through the CASPA portal.
| Category | Requirement |
|---|---|
| Minimum Overall GPA | 3.0 or higher |
| Minimum Science GPA | 3.0 or higher |
Note: Our admissions committee conducts a holistic review of every application, prioritizing candidates with a proven record of academic rigor and sustained excellence. A strong academic history significantly increases your likelihood of advancing to the interview stage.
DACA student admission
ATSU welcomes applications from individuals with Deferred Action for Childhood Arrivals (DACA) status. While we invite you to join our Physician Assistant program, please be advised that ATSU cannot guarantee licensure of DACA students by state licensing boards. ATSU strongly encourages all DACA applicants to consult with the licensing board in their intended state of practice to confirm eligibility. Additionally, DACA students are not eligible for Title IV federal financial aid but may be eligible for other types of financial assistance including private loans which may require a credit check to determine eligibility. To review types of aid available at ATSU click here.
International student admission
ATSU is not authorized to issue F-1 student visas for this program. Additionally, the program does not accept degrees from international institutions; all applicants must have completed their degree requirements at a United States college or university regionally accredited by an agency recognized by the U.S. Department of Education. It is the responsibility of the applicant to ensure their status and academic credentials meet these specific eligibility requirements prior to applying.
Prerequisite course requirements
All prerequisite courses must be completed in a U.S. college or university accredited by a US Department of Education institutional accreditor. Applicants may have up to two prerequisite courses in progress at the time of application. While these candidates remain eligible for an interview, any offer of admission will be contingent upon the successful completion of all outstanding prerequisites with a grade of "C" or higher. Official verification of completion must be submitted by July 1 prior to matriculation. To ensure academic readiness and student success, all prerequisite coursework must have been completed within seven years of the application date.
| Subject/Course | Semester credits | Quarter credits | Requirement notes |
|---|---|---|---|
| Human anatomy | 4 | 6 | Must include in-person lab |
| Human physiology | 4 | 6 | Must include in-person lab |
| Microbiology | 4 | 6 | Must include in-person lab |
| General chemistry I and II | 8 | 12 | Must include in-person lab Must complete full sequence |
| Biochemistry or organic chemistry | 3 | 4 | Lab not required |
| College statistics | 3 | 4 | Biostatistics or psychology statistics accepted |
| Medical terminology | 1 | 1 |
Note on Human Anatomy & Physiology: A combined Human Anatomy & Physiology course, with in-person labs for each, spanning two or more semesters and totaling 8 semester credits/12 quarter credits, is acceptable.
Technical standard requirement
Candidates must meet all program-defined technical standards at the time of matriculation and maintain these standards throughout the duration of the program. These requirements are essential for ensuring that students can successfully fulfill the clinical and academic demands of the curriculum and safely perform the duties required of a physician assistant.
CASPA Requirement
The CCPA Program reviews only applications that have reached Verified status through Central Application Service for Physician Assistants (CASPA). Achieving this status requires the successful submission of a complete application, all official transcripts, and three letters of recommendation no later than the October 1 deadline for the desired application cycle.
Secondary application requirement
Following the receipt of a verified CASPA application, the University admissions department emails a secondary application to candidates who meet the Program’s minimum admissions requirements. The secondary application and any applicable endorsement documents must be submitted by October 31 of the desired cycle to advance to the next stage of the CCPA Program review process.
Recommendation letters requirement
Applicants must submit three letters of recommendation from individuals who can personally attest to their professional work ethic, potential for academic success, and commitment to serving medically underserved populations. To ensure a comprehensive evaluation, letters should be authored by employers, supervisors, medical providers, or academic instructors/professors. Please note that recommendations from family members or personal friends are not accepted.
The CCPA Physician Assistant program does not grant advanced standing or transfer credits. All applicants, regardless of previous academic or professional background, are required to complete the full curriculum; as such, we do not offer advanced placement (AP), credit for prior experiential learning, or transfer credits from other programs. Additionally, CCPA has not entered into any articulation or transfer agreements with any other college or university.
The following technical standards are required for matriculation, progression, and graduation from the CCPA Program.
Sensory perception:
- Students must be able to observe and participate in all demonstrations, visual presentations in lectures and laboratories, and computer-assisted instruction. They must also be able to observe laboratory evidence and microbiologic cultures, as well as microscopic studies of microorganisms and tissues in normal and pathologic states.
- Students must be able to observe patients accurately and completely, both at a distance and closely. This ability requires functional vision, hearing, and somatic sensation.
- Students must be able to comprehend three-dimensional relationships and the spatial relationships of structures.
- Students must use their senses of vision, hearing, and smell to elicit information, perceive nonverbal communications, and describe mood, activity, and posture changes. They must also have the psychomotor abilities to perform all skills/tests in the physical exam, including inspection, palpation, auscultation, and percussion.
Interpersonal communication:
- Students must be able to relate to patients and family members and establish empathetic, professional, and effective relationships with them, including through speech, reading, and writing.
- Students are expected to communicate the examination results to the patient and to their colleagues accurately, clearly, and efficiently in oral, written, and electronic formats.
- Students are expected to be able to work collaboratively with all healthcare team members.
- Students must possess sufficient interpersonal skills to interact positively with people from all levels of society, all ethnic backgrounds, and all belief systems.
Motor function and strength:
- Students must be emotionally healthy to fully utilize their intellectual ability, exercise good judgment, and complete all responsibilities attendant to the diagnosis and care of patients.
- Students must tolerate physical, mental, and emotional stress throughout their training while continuing to function effectively.
- Students must possess qualities of adaptability and flexibility and be able to function in the face of uncertainty. They must also have a high level of compassion for others, motivation to serve, integrity, and a consciousness of social values.
- Students must be able to accept criticism and respond by appropriate behavior modification.
Intellectual:
- Students are expected to be able to display appropriate judgment in assessing and treating patients. In addition, they must learn and demonstrate the ability to recognize limitations in their knowledge, skills, and abilities and seek appropriate assistance with their identified limitations.
- Students are expected to possess perseverance, diligence, and consistency to complete the physician assistant curriculum and enter into the practice of medicine as certified and licensed PAs.
- Students must be able to problem-solve, collect, organize, prioritize, analyze, and assimilate large amounts of technically detailed and complex information within a limited time frame. This information will be presented in various educational settings, including lectures, small group discussions, and individual clinical settings. Students must be able to analyze, integrate, and apply this information appropriately for problem-solving and decision-making.
The CCPA program requires all students to provide documented proof of completion of all CDC-required immunizations, immunity, screenings, and certifications and maintain compliance with the requirements in this section for the duration of enrollment in the program. Students are responsible for all costs associated with this requirement. Failure to comply with the health requirements below may impact course standing, clinical placements, and graduation dates.
The ATSU College for Healthy Communities follows Centers for Disease Control (CDC) recommendations for vaccination and immunization. Assessment for immunity to disease will require documentation of the following:
-
COVID-19/Sars-CoV-2
- COVID-19 vaccinations and boosters are strongly recommended for all students.
- Please note that many of ATSU-CHC’s external clinical partners require students to be vaccinated prior to training in their facilities and exemptions may not be accepted. Clinical external rotation sites may require additional testing for their site and will be at the expense of the student. Consequently, unvaccinated students may be delayed in completing or unable to successfully complete program requirements.
-
Hepatitis B
- Documentation of two (2) dose series of Heplisav-B or three (3) dose series of Engerix-B, Recombivax or Twinrix Hepatitis B vaccine. Series must be started prior to matriculation and completed per prescribed timeline.
- OR documentation of POSITIVE immunity to Hepatitis B (Hep B Surface Antibody titer). If you receive a negative result after the primary series, you must complete a secondary Hepatitis B series followed by a repeat titer 1-2 months after the completed secondary series. If you have a negative result after the secondary series, additional testing including Hep B Surface Antigen must be performed. Please refer back to your Healthcare Provider and contact the Program Chair.
-
Influenza
- Due annually based on seasonal vaccine availability and due date will be set by ATSU-CHC.
- Documentation of seasonal Influenza vaccination.
-
Measles, mumps, and rubella (MMR)
- Documentation of two (2) doses of MMR vaccine. The doses must be started prior to matriculation and completed per prescribed timeline.
- OR documentation of POSITIVE immunity to each of Measles, Mumps and Rubella (IgG antibodies) in the last 3 years. If you receive a negative result, you must receive 2 doses of the MMR vaccine separated by 28 days.
- Repeat titer is not required.
-
Tetanus, diphtheria, and pertussis (Tdap)
- Documentation of one (1) adult dose of Tdap vaccine within ten (10) years of matriculation.
- DPT (infant dose) or Td vaccinations do not fulfill this requirement.
-
Varicella (chicken pox)
-
Documentation of two (2) doses of varicella vaccine.
- The doses must be started prior to matriculation and completed per prescribed timeline.
-
OR documentation of POSITIVE immunity to Varicella (IgG antibodies).
- If you receive a negative result you must complete 2 doses of the varicella vaccine 4-8 weeks apart.
- Repeat titer not required.
- History of this disease does NOT fulfill this requirement.
-
Documentation of two (2) doses of varicella vaccine.
-
Tuberculosis
Annual screening must have documentation for ONE of the following:
- A negative 2-step PPD skin test.
- A negative IRGA test (QuantiFERON TB Gold or T- Spot blood test).
- For students with a history of positive test results: a completed annual symptom evaluation and provider clearance (see below).
Students with one or more prior positive tests, LTBI (Latent Tuberculosis Infection), or TB (Tuberculosis) disease must provide:
- Documentation of prior positive test, and
- A chest radiograph confirming no active TB disease (obtained after the initial positive result; repeated only if symptomatic or starting LTBI therapy), and
- TB symptom evaluation and medical clearance from their healthcare provider within the past year.
Immunization exemptions:
Students may seek a request for exemption from preventive health requirements for medical or religious reasons. Documentation to backup the request may be required.
ATSU-CHC cannot guarantee placement in clinical rotations if an exemption is granted. Consequently, students receiving an exemption from preventive health requirements may take longer to complete the curriculum and graduate, or the student may not be able to complete the curriculum and graduate.
We invite you to explore A.T. Still University’s California campus in San Luis Obispo, where innovative healthcare education meets the character and charm of the Central Coast. With a collaborative learning environment, access to diverse clinical experiences, and a region known for its natural beauty, culture, and quality of life, the Central Coast offers an exceptional setting to pursue your future in healthcare. Experience life in San Luis Obispo and discover how ATSU’s California campus prepares students to become compassionate, community-focused healthcare professionals. Learn more about ATSU’s California campus.
Careers and outcomes
Physician assistants are found in all areas of medicine. PAs practice in family medicine, internal medicine, emergency medicine, pediatrics, obstetrics and gynecology, surgery and surgical specialties including orthopedics, psychiatry, and many other areas. Many PAs work in settings such as education, government, administration, and research.
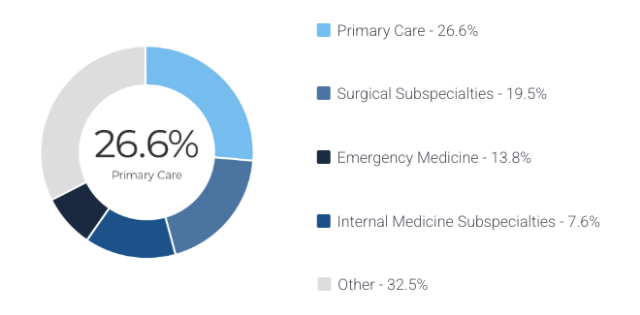


Students, alumni, and industry experts
When you gain entry to CCPA program, you are joining a collective dedicated to whole person healthcare and the advancement of the healthcare profession. Connect with our students, alumni, and faculty to hear how their experiences with ATSU propelled their careers.

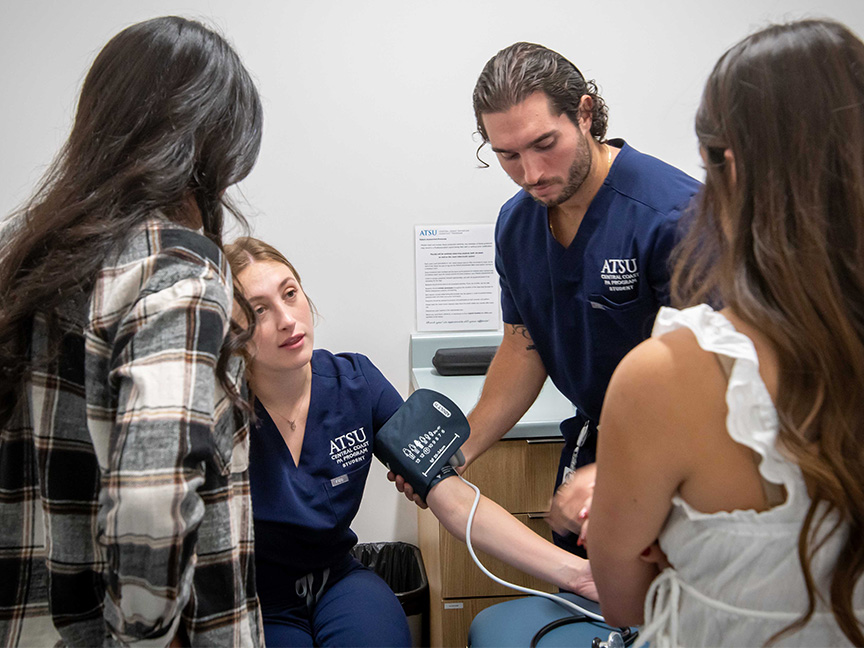

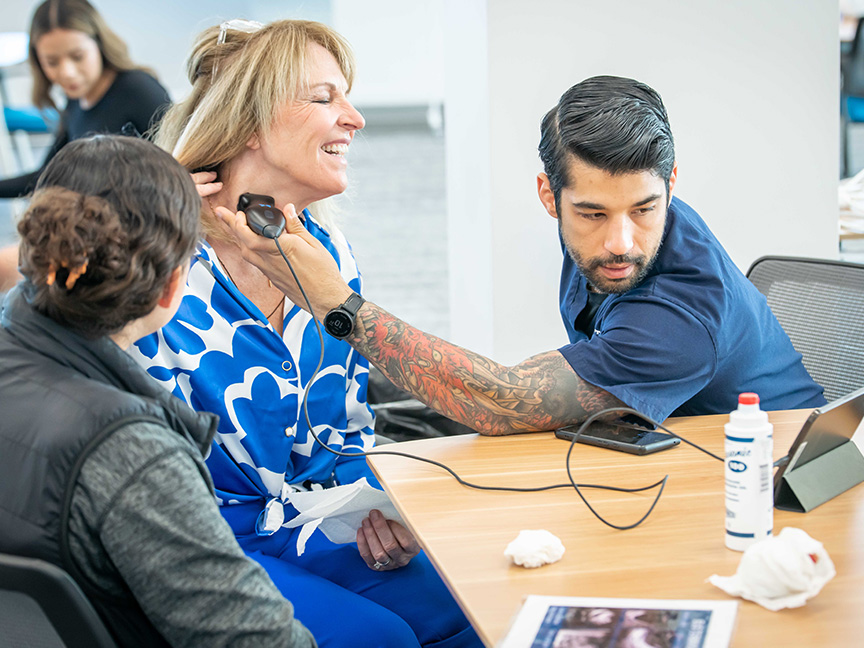
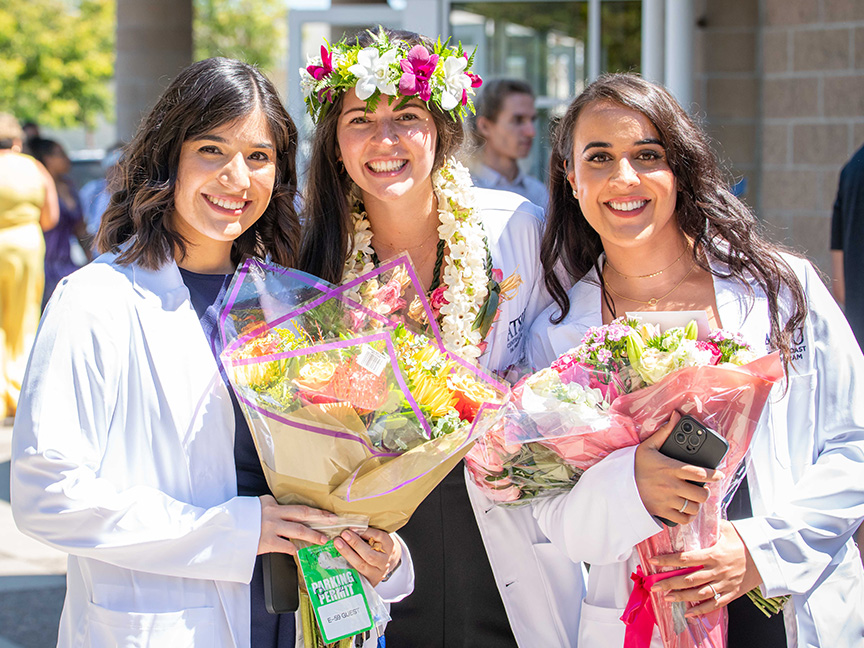


From white coats to graduation caps
Students and graduates reflect on their experience at ATSU with unforgettable moments and milestones.
Frequently asked questions
Q. What is the current ARC-PA accreditation status of the program?
A. The Accreditation Review Commission on Education for the Physician Assistant, Inc. (ARC-PA) has granted Accreditation-Continued status to the A.T. Still University of Health Sciences Central Coast Physician Assistant Program sponsored by A.T. Still University. Accreditation-Continued is an accreditation status granted when a currently accredited program is in compliance with the ARC-PA Standards. Accreditation remains in effect until the program closes or withdraws from the accreditation process or until accreditation is withdrawn for failure to comply with the Standards. The approximate date for the next validation review of the program by the ARC-PA will be January 2036. The review date is contingent upon continued compliance with the Accreditation Standards and ARC-PA policy. The program’s accreditation history can be viewed on the ARC-PA website at https://www.arc-pa.org/accreditation-history-at-still-university-central- coast/.
Q. Is a baccalaureate degree required for admission?
A. Yes. A baccalaureate degree or higher from a regionally accredited U.S. institution with a minimum 3.0 cumulative GPA must be completed prior to matriculation.
Q. Can I apply if I have prerequisite courses still in progress?
A. Yes. Applicants may have up to two (2) outstanding prerequisite courses at the time of application. These must be completed with a grade of “C” or higher and confirmed via transcript by July 1 prior to matriculation
Q: What are the requirements for the Anatomy and Physiology prerequisites?
A. You must complete either a combined Human Anatomy & Physiology I and II sequence or take standalone courses in Human Anatomy and Human Physiology. Coursework must be "Human" based. The CCPA Program does not accept exercise science, animal, or mammalian physiology to satisfy this requirement.
Q.What are the requirements for the Chemistry prerequisites?
A. Applicants must complete a full Chemistry I and II sequence. Additionally, you must complete one upper-level Chemistry course: either Biochemistry or Organic Chemistry. Combined "Survey of Chemistry" courses are not accepted to satisfy these requirements.
Q. Does a Medical Terminology certificate fulfill the Medical Terminology prerequisite?
A. No. You must earn at least one (1) college credit in a Medical Terminology course from a U.S. accredited university. Work experience or certificates are not accepted.
Q. Are the GRE or CASPer exams required?
A. No. GRE and CASPer scores are not required and will not be considered in the application review.
Q. What are the prerequisite courses?
A. See the Admissions Requirements
Q. Can I take prerequisites at your institution?
A. No. ATSU does not offer undergraduate courses.
Q. Do you accept evaluated foreign transcripts for prerequisites?
A. No. The CCPA Program only accepts prerequisites and degrees from U.S. regionally accredited institutions. Even if a credentialing service (like WES) evaluates your international coursework as "equivalent," it will not be accepted. All required courses must be taken at an accredited school within the United States.
Q: What information should be in the letters of recommendation?
A. Letters should be written by references who can authentically attest to your work ethic, interpersonal skills, and academic readiness. Your evaluators should clearly describe the nature and duration of your relationship and provide specific examples of your performance in healthcare settings. Ideally, these letters should reflect your commitment to the CCPA mission and your ability to succeed in a rigorous graduate program.
Q: Is there a minimum number of required clinical hours?
A. There is no set hourly requirement. However, the program gives preference to applicants with clinical experience, particularly those who have served in underserved healthcare settings.
Q: What type of clinical experience is recommended?
A. The CCPA Program prioritizes diverse, hands-on roles that involve direct patient care, such as Medical Assistant, EMT, Scribe, CNA, or Nurse. The program especially value experience gained in underserved communities or roles that involve managing patient histories and treatment plans. Other qualifying positions include Military Medics, Surgical Techs, and therapists. Overall, your experience should demonstrate a strong understanding of the PA profession and the challenges of frontline medicine.
Q. Can someone review my application, transcripts, or personal statement before I submit?
A. The program recommends reaching out directly to the Admissions Department for guidance on your application materials and submission process.
Q. Does the program offer advanced placement or accept transfer credits?
A. No. The CCPA program does not offer advanced placement or accept transfer credits from other institutions.
Q. How many students are accepted each year, and how many typically apply?
A. The program enrolls 90 students per cohort and receives over 1,000 CASPA verified applications per cycle.
Q. Does it make a difference for admission if I am an out-of-state applicant?
A. Residing in another state does not negatively impact your candidacy, and the CCPA Program encourages students from all regions to apply. While the program welcomes applicants from across the country, preference points are awarded to applicants who reside on California's Central Coast.
Q. Who serves on the PA Admissions Committee?
A. The committee is comprised of PA program faculty, staff, and practicing physician assistants.
Q. How do I apply to the CCPA program?
A. Submit your initial application through CASPA. Once verified, qualified applicants will receive a mandatory secondary application via email. Both applications must be completed to be considered for admission.
Q. Does the program use a rolling admissions process?
A. Yes. Applications are accepted and reviewed on a rolling basis. Please refer to the "Admissions Requirements" page for specific deadlines.
Q. How are interviews conducted and how should I prepare?
A. Interviews are held virtually via Zoom. To prepare, we recommend researching the PA profession, ATSU, and the CCPA mission, as well as reviewing the "Summary of Program Admissions Process" on our website. You should dress professionally and practice with "mock" interviews to build confidence and ensure you can authentically discuss your interest in the program.
Q: What is the policy regarding the use of AI or external aids during the interview?
A. To ensure interview integrity, the use of AI assistants, real-time transcription, generative tools, scripts, or external screens is strictly prohibited. We aim to get to know you through genuine, real-time interaction; therefore, the use of any unauthorized technical assistance or external aids will result in immediate disqualification from the selection process.
Q. What is a Hometown Scholar?
A. Hometown Scholars are applicants who have worked or volunteered at a Community Health Center (CHC) and have secured an official endorsement from that center. These applicants are guaranteed an interview, provided they meet all program admission requirements and submit their endorsement letter no later than the submission of their secondary application. If admitted to the program, Hometown Scholars are typically assigned to their endorsing CHC site for clinical year training. For further details on the application process, please visit the ATSU Hometown Scholar link.
Q. How will I be notified if I am invited for an interview?
A. Interview invitations are sent via email. Please ensure your contact information is current and monitored regularly.
Q. What happens if I have a finding on my criminal background check?
A. All positive findings must be reported to the University. Applicants must provide a detailed explanation and official court or police records. Findings are reviewed on an individual basis; however, certain findings—particularly felonies or violent crimes—may result in a denial of matriculation.
Q. What are the immunization requirements, and are exemptions available?
A. Vaccine requirements can be found in the ATSU Student Catalog. While students may request medical or religious exemptions, the program cannot guarantee clinical rotation placement if an exemption is granted. This may result in an inability to complete the curriculum or graduate.
Q. Are health and malpractice insurance required?
A. Yes. Students must provide proof of personal health insurance. Malpractice insurance is provided by the university for all students during their time in the program.
Q. Is there a personal appearance or dress code policy?
A. Yes. Specific policies regarding professional appearance are outlined in the Program Guide.
Q. How long is the program and can I attend part-time?
A. The program is 24 months (12 months didactic, 12 months clinical). Because of the nature of the curriculum, part-time attendance is not an option.
Q. Where is the program located?
A. The first year is held at the ATSU Campus in San Luis Obispo, California. The second year consists of clinical rotations at CHC locations across California and the United States.
Q. Does the program utilize a cadaver lab?
A. No. We teach clinical anatomy using high-fidelity digital platforms, 3D dissection, and radiological imaging. This modern approach allows students to focus on "living anatomy" and use the same diagnostic tools they will use in clinical practice, providing a clearer view of anatomical variations than traditional cadaver tissue allows.
Q. Am I allowed to work while enrolled in the program?
A. Due to the rigorous schedule and academic demands, the faculty strongly discourages students from working during the program.
Q. Will I need to move to California?
A. Yes. For the Didactic Year, students must relocate to the San Luis Obispo area. During the Clinical Year, students are assigned to various Community Health Center locations.
Q. Does the program provide shadowing opportunities?
A. No, the program does not currently offer or coordinate shadowing experiences for applicants.
Q. What is the tuition for the program?
A. Tuition and fees are subject to change by the University Board of Trustees. Please visit the official CCPA website for the most up-to-date cost information.
Q. Are there specific technology requirements?
A. Yes. Students are required to have a laptop that meets the university’s technical specifications prior to matriculation. You can view the full list of requirements on the ATSU technology page.
Q: Where are classes held and what is the campus like?
A. Didactic classes take place at our 63,973-square-foot learning center in San Luis Obispo, California. The facility is purpose-built for medical training, featuring high-fidelity simulation suites, 10 clinical education rooms, dedicated skills labs, and a full-service library. Beyond the classroom, students have access to a four-level parking structure, on-site catering, and spacious outdoor commons. The campus is ideally located just minutes from downtown and the coast, allowing students to balance their studies with the outdoor activities and scenery of one of America’s "happiest places."
Q. Is student housing available?
A. ATSU does not provide student housing, but many students find accommodations in neighboring communities.
Any further questions, contact the Admissions Office at admissions@atsu.edu or call 660.626.2237.
Accreditation
A.T. Still University of Health Sciences is accredited by the
Higher Learning Commission
230 S. LaSalle Street, Suite 7-500,
Chicago, IL 60604
Phone: 800.621.7440
Fax: 312.263.7462
Email: info@hlcommission.org
Web: hlcommission.org
The Accreditation Review Commission on Education for the Physician Assistant, Inc. (ARC-PA) has granted Accreditation-Continued status to the A.T. Still University of Health Sciences Central Coast Physician Assistant Program sponsored by A.T. Still University. Accreditation-Continued is an accreditation status granted when a currently accredited program is in compliance with the ARC-PA Standards. Accreditation remains in effect until the program closes or withdraws from the accreditation process or until accreditation is withdrawn for failure to comply with the Standards. The approximate date for the next validation review of the program by the ARC-PA will be January 2036. The review date is contingent upon continued compliance with the Accreditation Standards and ARC-PA policy.
The program’s accreditation history can be viewed on the ARC-PA website.
The California Bureau for Private Postsecondary Education (BPPE) requires institutions submit an Annual Report as part of an ongoing compliance program. The Annual Report is due by Dec. 1 of each year, and is required to include specific information related to the educational programs offered by the institution in the reporting period. Visit the Bureau’s Annual Report Summary page and locate the institution’s name or click Annual Report.
Reporting Title IX-Sexual Harassment, Discrimination, and Misconduct (A1.02g)
Sexual harassment and discrimination or harassment based on race, color, religion, ethnicity, national origin, sex (including pregnancy), gender, sexual orientation, gender identity, age, disability, veteran status, or any other status protected by Title IX law. Procedures for reporting such offenses are outlined in ATSU Policy #90-210: Prohibition of Discrimination, Harassment, and Retaliation, which is detailed in the A.T.Still University Catalog.
Student Employment for the Program (A3.02; A3.03; A3.14i)
Students are not required to work for the CCPA Program. Students are also prohibited from substituting for or functioning as instructional faculty and/or clinical or administrative Program staff.
Identification As a PA Student (A3.04)
An ATSU identification badge (ID) will be issued to all students to obtain entrance to campus activities and facilities and to identify them as PA students. Students must always have their ID on their upper chest on campus and during clinical rotations. Students with their ID Badge may be allowed access to campus facilities. Students may be required to wear a separate ID badge at clinical sites. The clinical site(s) will make arrangements if needed. PA students must be identified as students in the clinical setting to distinguish them from other health profession students and practitioners.
Student Health Records and Medical Treatment (A3.06, A3.18)
Student health records are confidential and are not accessible to or reviewed by the Program Faculty or staff except for immunization and tuberculosis screening results. Except in an emergency situation, the Program Director, Medical Director, and Principal Faculty may not participate as health care providers or behavioral counselors for students in the Program.
OSHA Safety Training (A3.05a)
To prevent exposure to environmental and infectious hazards, students are responsible for following Occupational Safety and Health Administration (OSHA) and universal precaution guidelines during all CCPA program volunteer activities and at each clinical site. Students will receive OSHA training during the didactic year before starting clinical rotations. Any student who needs help with OSHA guidelines should contact program faculty for further training. OSHA information can be found at https://www.osha.gov/.
Exposure to Infectious and Environmental Hazards Policy and Procedure (A3.05b,c)
Suppose a student experiences a needle stick injury or is exposed to a patient’s blood or other contagious body fluid while participating in educational activities or at clinical sites. In that case, the student must report the incident to the program and initiate medical care immediately. The University will endeavor to ensure that medical insurance coverage for students is in effect throughout the Program. Still, students are financially responsible for their medical insurance and any medical care they receive due to injury or exposure throughout the Program.
Student Counseling Services (A3.07)
TimelyCare, timelycare.com/atsu, is a 24/7 virtual extension of ATSU Behavioral Health & Wellness resources to improve student well-being, engagement, and retention. TimelyCare can be accessed via phone or other device to access virtual care from licensed physicians and counselors in all 50 states at no cost. Timely care services include:
- On-demand or appointment-based medical care
- On-demand or appointment-based mental health support
- Health Coaching and digital self-care content
Refer to ATSU’s Health & Wellness page for more information on University counseling services.
Clinical Site Recruitment Policy and Procedures (A3.08)
The program publishes, makes readily available to current and prospective students, and consistently applies a policy stating that PA students are not required to provide or solicit clinical sites or preceptors.
Student Employment While Enrolled in the Program (A3.14i)
Due to the significant time commitment required, outside employment is strongly discouraged while enrolled in the CCPA Program. Students who still elect to work outside the Program may be employed up to eight hours per week during any term. Attendance is mandatory, so PAAR requests for work will not be approved unless they are related to a military assignment. No assignments, examinations, or schedules will be adjusted due to a student’s outside work schedule.
Academic Grievances (A3.14g)
Students seeking to dispute an exam grade, assessment, or academic course concern must submit a written appeal to the Course Director within three (3) working days. If the matter is not resolved within three (3) working days of receipt, the student may escalate the grievance to the Director of Didactic Education (for didactic year concerns) or the Director of Clinical Education (for clinical year concerns). Should the issue remain unresolved after this departmental review, the student may bring the matter to the Program Director for final program-level consideration. Detailed procedures and timelines for final course grade appeals are maintained in the University Catalog.
Grievance Involving Employees or the Program (A3.14g) (A1.02g)
Any non-academic grievance directed toward a staff member, faculty member, or the Program itself must be reported to the Dean of the College of Health Communities in accordance with the University Catalog policies. Students are expected to follow the established chain of command when filing formal complaints to ensure a systematic review. To assist in this process, ATSU Student Affairs provides access to dedicated staff members who can advise and support students in navigating the grievance resolution process. For any grievances involving Title IX complaints, students must bypass this internal program process and follow the specific reporting procedures outlined in the University’s Title IX policy.
Grievances Involving Another Student (A3.14g) (A1.02g)
Students who wish to report a grievance or misconduct involving a peer are encouraged to first address the individual directly with the intent of reaching a professional resolution. If such a conversation is deemed inappropriate or likely to exacerbate the situation, the incident should be reported directly to the student’s faculty advisor. For any grievances involving Title IX complaints, students must bypass this internal program process and follow the specific reporting procedures outlined in the University’s Title IX policy.
Grievances Involving Clinical Rotations (A3.14g) (A1.02g)
Students encountering academic, professional, or personal concerns during clinical rotations should initially attempt to resolve the issue directly with their Preceptor or Regional Director of Physician Assistant Education (RDPAE). If the matter remains unresolved, or if the student identifies an immediate safety risk, they must contact the Clinical Team (ccpa-clinical@atsu.edu) without delay for further intervention. For any grievances involving Title IX complaints, students must bypass this internal program process and follow the specific reporting procedures outlined in the University’s Title IX policy.